Commentary
Value Equity 3Q 2024
Markets Review

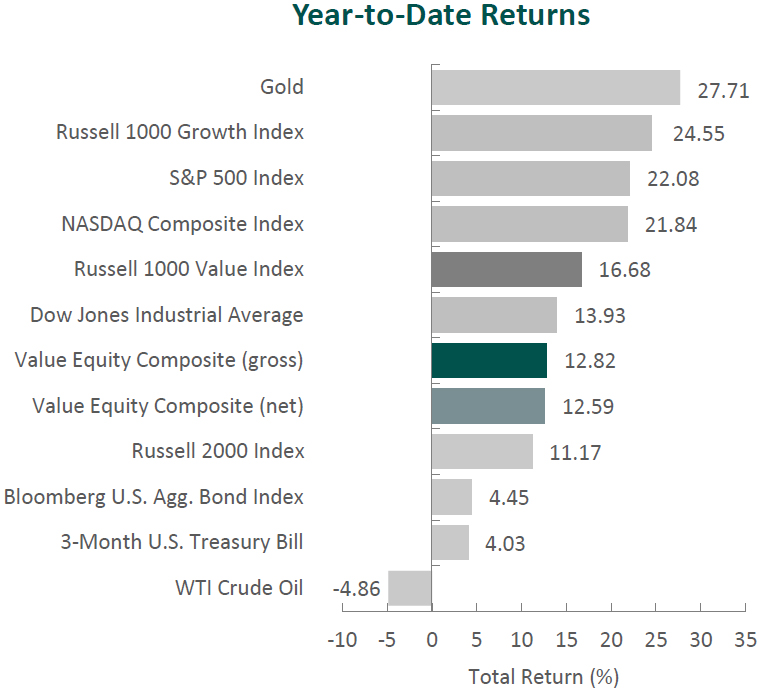
Sources: CAPS CompositeHubTM, Bloomberg
Past performance is not indicative of future results. Aristotle Value Equity Composite returns are presented gross and net of investment advisory fees and include the reinvestment of all income. Gross returns will be reduced by fees and other expenses that may be incurred in the management of the account. Net returns are presented net of actual investment advisory fees and after the deduction of all trading expenses. Aristotle Capital Composite returns are preliminary pending final account reconciliation. Please see important disclosures at the end of this document.
The U.S. equity market continued its ascent to new record highs, with the S&P 500 Index increasing 5.89% during the period. However, unlike last quarter, the market showed broader gains, with the S&P 500 Equal Weight Index outperforming the cap-weighted S&P 500 Index by 3.71%. Concurrently, the Bloomberg U.S. Aggregate Bond Index rose 5.20% for the quarter as interest rates declined. In terms of style, the Russell 1000 Value Index outperformed its growth counterpart by 6.24%.
Across sectors, gains were broad-based, as ten out of eleven within the Russell 1000 Value Index finished higher. Sector leaders included Utilities, Real Estate and Consumer Discretionary. Meanwhile, Energy (the only sector to finish in the red), Information Technology and Communication Services were the worst.
After slowing down for two consecutive quarters, U.S. economic growth accelerated to an annualized rate of 3.0%, as consumer spending and private inventory investments increased. Additionally, inflation inched closer to the Federal Reserve’s 2.0% target, with the CPI increasing at an annualized rate of 2.5% in August and 2.9% in July. Meanwhile, the U.S. labor market cooled slightly, with unemployment at 4.2% and nominal wage growth moderating during the period.
Given the ongoing progress toward target inflation and a softening labor market, the Federal Reserve lowered the target range of the federal funds rate by 50 basis points to 4.75% to 5.00%. Fed Chair Powell acknowledged that loosening policy restraint too quickly could undo progress on inflation, whereas moving too slowly could undermine economic activity and weaken employment. Therefore, Powell stressed the importance of monitoring economic data before making further adjustments to monetary policy.
Corporate earnings remained strong, with S&P 500 companies reporting earnings growth of 11.3%, the highest year-over-year improvement since 2021. Furthermore, only 67 S&P 500 companies issued negative EPS guidance, and about 80% exceeded estimates. Reflecting the general trend of disinflation and a resilient domestic economy, fewer companies mentioned topics like “inflation” and “recession” during earnings calls.
In political news, President Biden announced he would not seek re-election. Vice President Kamala Harris was subsequently named the official Democratic presidential nominee for the 2024 election. In geopolitics, tensions in the Middle East escalated as clashes between Israeli forces and Hezbollah fighters intensified. In response, the U.S. announced the urgent deployment of additional troops to the region in case of a wider regional conflict, while simultaneously mediating a potential ceasefire between the groups.
Performance and Attribution Summary
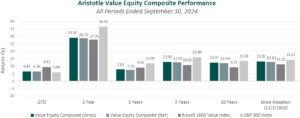
For the third quarter of 2024, Aristotle Capital’s Value Equity Composite posted a total return of 6.47% gross of fees (6.39% net of fees), underperforming the 9.43% return of the Russell 1000 Value Index and outperforming the 5.89% return of the S&P 500 Index. Please refer to the table for detailed performance.
| Performance (%) | 3Q24 | YTD | 1 Year | 3 Years | 5 Years | 10 Years |
|---|---|---|---|---|---|---|
| Value Equity Composite (gross) | 6.47 | 12.82 | 29.10 | 7.82 | 12.90 | 12.37 |
| Value Equity Composite (net) | 6.39 | 12.59 | 28.75 | 7.55 | 12.61 | 12.03 |
| Russell 1000 Value Index | 9.43 | 16.68 | 27.76 | 9.03 | 10.69 | 9.23 |
| S&P 500 Index | 5.89 | 22.08 | 36.35 | 11.91 | 15.98 | 13.38 |

Source: FactSet
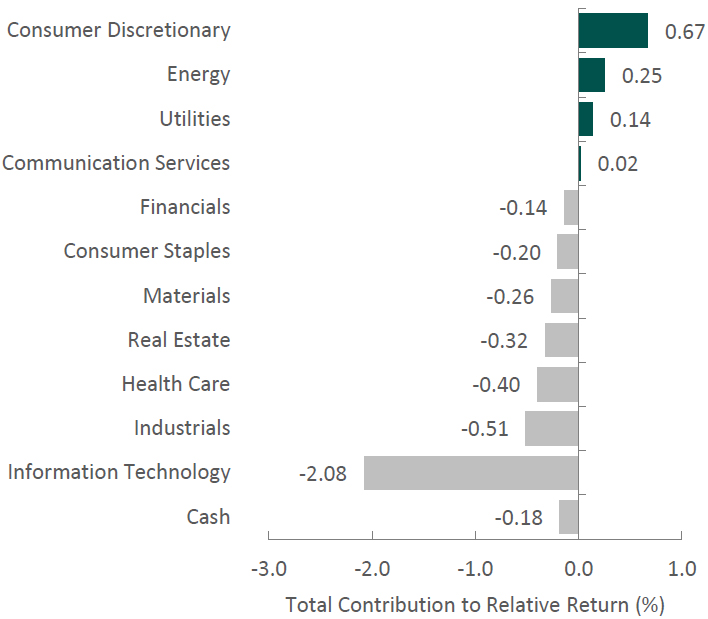
Past performance is not indicative of future results. Attribution results are based on sector returns which are gross of investment advisory fees. Attribution is based on performance that is gross of investment advisory fees and includes the reinvestment of income.
The portfolio’s underperformance relative to the Russell 1000 Value Index in the third quarter can be primarily attributed to security selection, while allocation effects also had a slightly negative impact. Security selection in Information Technology and Industrials and an overweight in Information Technology detracted the most from relative performance. Conversely, security selection in Consumer Discretionary, an underweight in Energy and an overweight in Utilities contributed. (Relative weights are the result of bottom-up security selection.)
Contributors and Detractors for 3Q 2024
| Relative Contributors | Relative Detractors |
|---|---|
| Parker Hannifin | Qualcomm |
| Lennar | Microchip Technology |
| Blackstone | Adobe |
| Atmos Energy | Microsoft |
| Xcel Energy | Merck |
Microchip Technology, the microcontroller (MCU) and analog semiconductor producer, was a primary detractor for the period. The company reported results in line with guidance, but its short-term outlook remains challenged. Between 2021-2023, amid a global chip shortage, Microchip implemented a preferred supply program to meet the large demands of its clients, who overestimated their needs and are now working through their inventory levels. While management has started to see some positive signs pointing toward a recovery (e.g., higher expedited orders and fewer order cancelations), it is taking longer than anticipated. Longer term, Microchip has been able to generate 15+ years of robust FREE cash flow and margins, while lowering its debt and consistently returning money to shareholders. This, we believe, speaks to the company’s proven ability to manage the business through economic cycles, while taking advantage of its broad portfolio to continue gaining share in areas including IoT, 5G infrastructure, autonomous driving and data centers.
Blackstone, one of the world’s largest alternative asset managers, was a leading contributor for the period. Blackstone reported nearly $40 billion in inflows and deployed $34 billion during the quarter, its highest investment activity in two years. With over $180 billion in dry powder, the company possesses significant purchasing power to invest in attractive opportunities such as its recent $24 billion acquisition of data center platform AirTrunk, its largest investment in the Asia/Pacific region. Moreover, Blackstone continues to make progress in penetrating the retail and private wealth channels, as the company raised $7.5 billion overall during the quarter, with assets raised in perpetual vehicles over the first half of 2024 eclipsing full-year totals in 2023. BCRED (a private credit vehicle), BREIT (a private real estate vehicle) and the newly launched BXPE (a private equity vehicle) have all seen encouraging signs with new inflows. Despite BREIT’s challenges last year, all redemption requests since February have been fulfilled at 100%, and requests in June were down 85% from the peak of 2023. As the overall industry fundamentals improve, we believe Blackstone’s first-mover and distribution advantages in its retail initiatives and its overall reputation as a best-in-class operator will continue to create shareholder value.
Recent Portfolio Activity
| Buys | Sells |
|---|---|
| American International Group | Autodesk |
| Verizon Communications |
During the quarter, we sold our position in Autodesk and invested in American International Group and Verizon Communications.
We first invested in Autodesk—the global industry standard for computer‐aided design in the architecture, engineering and construction industry (AEC)—during the second quarter of 2022. During our holding period, the company remained at the cutting edge of enabling improvement through innovation and promoting the use of open standards, or open building information modeling (BIM). The company also improved its profitability, supported by further adoption of its cloud offerings. We continue to believe the company is uniquely positioned to benefit, as the AEC industry has increasingly sought to resolve the inefficiencies that arise when many parties are needed to complete a building project. However, we decided Autodesk was the best candidate for sale to fund what we believe to be a more optimal investment in Verizon Communications.
Verizon Communications Inc.
Headquartered in New York, Verizon is one of the largest telecommunications companies in the U.S. The company was formed in 2000 with the combination of Bell Atlantic Corp. and GTE Corp., businesses with roots dating back to the late 19th century and the beginning of the telephone business.
Over the years, Verizon has expanded through strategic acquisitions and innovations, particularly in wireless technology, which has become the cornerstone of its business. Unlike its competitor AT&T’s strategy of vertical integration through the acquisition of media and entertainment companies, which AT&T is now unwinding, Verizon has instead focused on expanding its fiber networks in major cities and acquiring wireless spectrum to increase network capacity and performance. Today, Verizon’s wireless services account for approximately 70% of its revenue (serving over 90 million postpaid and 20 million prepaid phone customers), making it the country’s largest wireless carrier. Verizon also offers fixed-line operations with local networks in the Northeastern U.S., serving over 30 million homes and businesses and nine million broadband customers. In early September, Verizon announced the $20 billion all-cash acquisition of Frontier, the largest pure-play fiber internet provider in the U.S. Upon closing (expected within 18 months), Verizon’s fiber network will expand to 31 states.
High-Quality Business
Some of the quality characteristics we have identified for Verizon include:
- Strong brand reputation for network reliability and speed, along with the broadest wireless coverage in the industry, supports premium pricing and customer loyalty in the form of low churn;
- Leading market share in wireless and economies of scale allow Verizon to generate high margins and returns on invested capital; and
- Verizon’s position at the forefront of 5G technology, combined with its spectrum licenses and the capital-intensive nature of building and maintaining network infrastructure, creates high barriers to entry.
Attractive Valuation
Based on our estimates of normalized earnings, we believe Verizon’s current stock price is offered at a discount to the company’s intrinsic value. More specifically, we believe the company is trading at a CFRoEV greater than 10%, which translates to an attractive discount to intrinsic value.
Compelling Catalysts
Catalysts we have identified for Verizon, which we believe will cause its stock price to appreciate over our three- to five-year investment horizon, include:
- Higher FREE cash flow generation as prior large investments (e.g., 5G rollout and spectrum purchases) season, resulting in lower capital intensity;
- Enhanced revenue as more consumers upgrade to 5G-enabled devices, which should lead to increased data usage, higher-value service plans and an expanded customer base;
- Market share gains in broadband internet service as customers switch from traditional cable companies; and
- Increased connections per account and higher ARPU by way of Verizon’s ability to bundle services (like wireless, home internet and media content), which encourages adding more devices and drives higher overall spending.
American International Group, Inc.
Established in 1919 and headquartered in New York, American International Group (AIG) is one of the largest global insurance companies. AIG provides a comprehensive range of property and casualty (P&C) insurance to businesses and individuals in over 190 countries and jurisdictions around the world. The company also has a ~48% stake in Corebridge Financial (Corebridge), AIG’s old Life & Retirement segment.
AIG’s government bailout following the 2008 global financial crisis left the company on a 10+ year journey to transform its business (including five CEOs) by streamlining operations and attempting to improve its image with the public and investor community. Since taking over the General Insurance business in 2017 and assuming the role of CEO in 2021, Peter Zaffino has restructured underwriting and increased levels of reinsurance to reduce risk and control volatility, implemented a new structure for its High Net Worth business, divested non-core divisions such as crop risk and personal travel, and separated its Life & Retirement segment into the independently publicly traded company Corebridge. Following these actions, AIG will be a purely General Insurance focused business, with roughly 75% of its premiums tied to commercial and 25% to personal policies. We believe with Mr. Zaffino’s emphasis on risk-adjusted returns, AIG has become a stronger, more focused organization.
High-Quality Business
Some of the quality characteristics we have identified for AIG include:
- Robust brand, market position and client relationships give it scale, with over $160 billion in assets and over $25 billion in net written premiums[1];
- Well diversified across product lines, sectors and geographies; and
- Innovative management team led by Chairman and CEO Peter Zaffino, whose focus has shifted from remediation (e.g., enhancing the underwriting culture and improving the financial profile) to preparing the company for future growth.
Attractive Valuation
We believe AIG is poised to improve underwriting, reduce expenses and return greater capital to shareholders, resulting in higher normalized earnings that correspond to a CFRoEV of around 8%. Moreover, AIG is one of the uncommon (for Aristotle Capital) investments where the discount to intrinsic value we see is due to both improved earnings and multiple expansion.
Compelling Catalysts
Catalysts we have identified for AIG, which we believe will cause its stock price to appreciate over our three- to five-year investment horizon, include:
- Completion of Peter Zaffino’s business transformation (i.e., focus on General Insurance following divestitures, including the complete exit of Corebridge; improving underwriting culture; and disciplined capital management) should result in higher normalized earnings, cash flow and return on equity;
- Further expense management through operational initiatives (e.g., AIG Next) and tighter underwriting;
- Continued transformation of the firm’s High Net Worth business, utilizing a managing general agent model, should result in higher volumes and more efficiencies; and
- Enhanced financial flexibility following a reduction in leverage as well as excess capital, which we believe will continue to allow for greater returns of capital to shareholders (e.g., the ongoing $10 billion share repurchase program and consecutive years of 10% dividend growth).
Conclusion
With the evolving global macroeconomic landscape, increasing geopolitical tensions and the approaching U.S. elections, there are plenty of headlines to follow. At Aristotle Capital, our priority is determining whether these events provide valuable insights for long-term investors. Instead of repositioning our portfolios based on predictions of how the market may or may not respond to such events, we focus on identifying and owning companies that, we believe, can succeed in the face of global uncertainty. It is our belief and experience that well-managed, high-quality companies will take appropriate actions to respond to the ever-changing world.
[1] These figures are estimated based on the run rate as of June 30th after the deconsolidation of AIG’s Life & Retirement segment.
The opinions expressed herein are those of Aristotle Capital Management, LLC (Aristotle Capital) and are subject to change without notice. Past performance is not a guarantee or indicator of future results. This material is not financial advice or an offer to purchase or sell any product. You should not assume that any of the securities transactions, sectors or holdings discussed in this report were or will be profitable, or that recommendations Aristotle Capital makes in the future will be profitable or equal the performance of the securities listed in this report. The portfolio characteristics shown relate to the Aristotle Value Equity strategy. Not every client’s account will have these characteristics. Aristotle Capital reserves the right to modify its current investment strategies and techniques based on changing market dynamics or client needs. There is no assurance that any securities discussed herein will remain in an account’s portfolio at the time you receive this report or that securities sold have not been repurchased. The securities discussed may not represent an account’s entire portfolio and, in the aggregate, may represent only a small percentage of an account’s portfolio holdings. The performance attribution presented is of a representative account from Aristotle Capital’s Value Equity Composite. The representative account is a discretionary client account which was chosen to most closely reflect the investment style of the strategy. The criteria used for representative account selection is based on the account’s period of time under management and its similarity of holdings in relation to the strategy. Recommendations made in the last 12 months are available upon request.
Returns are presented gross and net of investment advisory fees and include the reinvestment of all income. Gross returns will be reduced by fees and other expenses that may be incurred in the management of the account. Net returns are presented net of actual investment advisory fees and after the deduction of all trading expenses.
All investments carry a certain degree of risk, including the possible loss of principal. Investments are also subject to political, market, currency and regulatory risks or economic developments. International investments involve special risks that may in particular cause a loss in principal, including currency fluctuation, lower liquidity, different accounting methods and economic and political systems, and higher transaction costs. These risks typically are greater in emerging markets. Securities of small‐ and medium‐sized companies tend to have a shorter history of operations, be more volatile and less liquid. Value stocks can perform differently from the market as a whole and other types of stocks.
The material is provided for informational and/or educational purposes only and is not intended to be and should not be construed as investment, legal or tax advice and/or a legal opinion. Investors should consult their financial and tax adviser before making investments. The opinions referenced are as of the date of publication, may be modified due to changes in the market or economic conditions, and may not necessarily come to pass. Information and data presented has been developed internally and/or obtained from sources believed to be reliable. Aristotle Capital does not guarantee the accuracy, adequacy or completeness of such information.
Aristotle Capital Management, LLC is an independent registered investment adviser under the Advisers Act of 1940, as amended. Registration does not imply a certain level of skill or training. More information about Aristotle Capital, including our investment strategies, fees and objectives, can be found in our ADV Part 2, which is available upon request. ACM-2410-38

Sources: CAPS CompositeHubTM, Russell Investments, Standard & Poor’s

Composite returns for all periods ended September 30, 2024 are preliminary pending final account reconciliation.
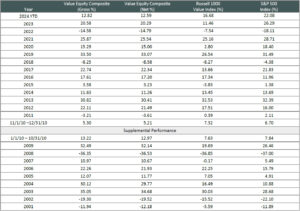
Past performance is not indicative of future results. The information provided should not be considered financial advice or a recommendation to purchase or sell any particular security or product. Performance results for periods greater than one year have been annualized. The Aristotle Value Equity strategy has an inception date of November 1, 2010; however, the strategy initially began at Mr. Gleicher’s predecessor firm in October 1997. A supplemental performance track record from January 1, 2001 through October 31, 2010 is provided above. The returns are based on two separate accounts and performance results are based on custodian data. During this time, Mr. Gleicher had primary responsibility for managing the two accounts, one account starting in November 2000 and the other December 2000.
Returns are presented gross and net of investment advisory fees and include the reinvestment of all income. Gross returns will be reduced by fees and other expenses that may be incurred in the management of the account. Net returns are presented net of actual investment advisory fees and after the deduction of all trading expenses.
The Russell 1000 Value® Index measures the performance of the large cap value segment of the U.S. equity universe. It includes those Russell 1000 Index companies with lower price-to-book ratios and lower expected growth values. The S&P 500® Index is the Standard & Poor’s Composite Index of 500 stocks and is a widely recognized, unmanaged index of common stock prices. The S&P 500 Equal Weight Index is designed to be the size-neutral version of the S&P 500. It includes the same constituents as the cap-weighted S&P 500, but each company in the S&P 500 Equal Weight Index is allocated the same weight at each quarterly rebalance. The Russell 1000® Growth Index measures the performance of the large cap growth segment of the U.S. equity universe. It includes those Russell 1000 companies with higher price-to-book ratios and higher forecasted growth values. The Russell 2000® Index measures the performance of the small cap segment of the U.S. equity universe. The Russell 2000 Index is a subset of the Russell 3000® Index representing approximately 10% of the total market capitalization of that index. It includes approximately 2,000 of the smallest securities based on a combination of their market cap and current index membership. The Dow Jones Industrial Average® is a price-weighted measure of 30 U.S. blue-chip companies. The Index covers all industries except transportation and utilities. The NASDAQ Composite Index measures all NASDAQ domestic and international based common type stocks listed on The NASDAQ Stock Market. The NASDAQ Composite includes over 3,000 companies, more than most other stock market indexes. The Bloomberg U.S. Aggregate Bond Index is an unmanaged index of domestic investment grade bonds, including corporate, government and mortgage-backed securities. The WTI Crude Oil Index is a major trading classification of sweet light crude oil that serves as a major benchmark price for oil consumed in the United States. The 3-Month U.S. Treasury Bill is a short-term debt obligation backed by the U.S. Treasury Department with a maturity of three months. The Consumer Price Index is a measure of the average change over time in the prices paid by urban consumers for a market basket of consumer goods and services. The volatility (beta) of the Composite may be greater or less than its respective benchmarks. It is not possible to invest directly in these indexes.


