Commentary
Value Equity 2Q 2023
Markets Review

Sources: SS&C Advent, Bloomberg
Past performance is not indicative of future results. Aristotle Value Equity Composite returns are presented gross and net of investment advisory fees and include the reinvestment of all income. Gross returns will be reduced by fees and other expenses that may be incurred in the management of the account. Net returns are presented net of actual investment advisory fees and after the deduction of all trading expenses. Aristotle Capital Composite returns are preliminary pending final account reconciliation. Please see important disclosures at the end of this document.
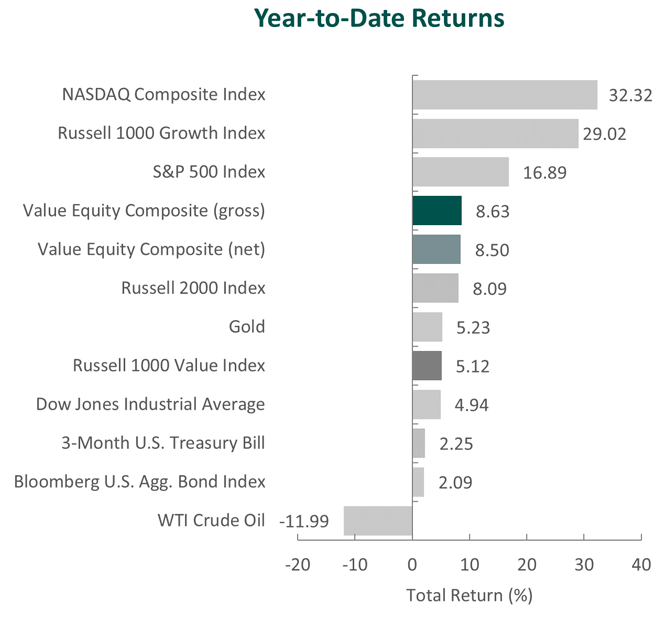
The U.S. equity market continued its rebound, as the S&P 500 Index rose 8.74% during the quarter. However, the market rally has been remarkably concentrated, with just 25% of stocks outperforming the S&P 500 in the first 6 months of 2023. This makes it the narrowest market breadth in history for the first half of a year.1 Concurrently, the Bloomberg U.S. Aggregate Bond Index slightly declined, returning ‑0.84% for the quarter. In terms of style, the Russell 1000 Growth Index outperformed its value counterpart by 8.74%
On a sector basis, nine out of the eleven sectors within the Russell 1000 Value Index finished higher. Communication Services, Industrials and Consumer Discretionary gained the most. Meanwhile, Utilities, Energy and Materials were the worst-performing sectors.
Despite the positive trajectory of the market, economic data points were mixed. After expanding by 2.6% year-over-year in the fourth quarter of last year, growth in the U.S. slowed in the first quarter to 2.0%, as private inventory investment and residential fixed investment declined. Nevertheless, personal consumption expenditures remained strong, increasing by 4.2% from last year. Meanwhile, inflation remained above its historical average of 3.8%, but the CPI continued to decline, as the figure fell from 4.9% to 4.0% for the 12-month periods ending in April and May, respectively. The moderation in prices was driven by a decline in the major energy component indexes. Lastly, the labor market remained tight, with unemployment at 3.7% in May.
In addition to economic data, lingering stress at regional banks, as well as political risk, came into focus during the period. Although significant efforts were previously made to provide stability to the U.S. banking system, the collapse of First Republic Bank, the largest banking failure since 2008, reignited concerns. However, the government quickly seized the bank and sold it to JPMorgan Chase, reassuring depositors. The government’s action, combined with minimal increases in default rates, resilient asset performance and loan growth, and stable deposits at other regional banks eased fears surrounding the industry. Subsequently, attention turned to the approaching deadline to raise the federal debt ceiling. Concerns of a potential U.S. default mounted as the political parties refused to budge on concessions for a deal. After weeks of negotiations, an agreement was eventually reached to suspend the federal debt ceiling for two years while limiting the growth of federal discretionary spending during that same time span.
With the volatile and uncertain macroeconomic backdrop and continued pattern of disinflation, the Federal Reserve held rates steady in June, marking the first pause after a ten-meeting hiking campaign that brought the benchmark rate to a range of 5.00% to 5.25%. The Federal Reserve Open Market Committee emphasized the need to account for the cumulative tightening of monetary policy and the lagging effects of monetary policy decisions, as well as other economic and financial developments, in order to determine whether additional policy firming would be needed to achieve the 2% goal for inflation.
On the corporate earnings front, S&P 500 companies reported a decline in earnings of 2.2%, the second straight quarter of a year-over-year decrease. However, results were better than initial expectations of a 6.7%2 decline, as companies referenced successful cost cutting, improved operational efficiency and waning inflationary pressures. Overall, 78% of S&P 500 companies exceeded EPS estimates (above the five-year average of 77%), and the number of companies mentioning inflation on earnings calls declined by over 12%.
Performance and Attribution Summary
For the second quarter of 2023, Aristotle Capital’s Value Equity Composite posted a total return of 4.56% gross of fees (4.51% net of fees), outperforming the 4.07% return of the Russell 1000 Value Index and underperforming the 8.74% return of the S&P 500 Index. Please refer to the table for detailed performance.
| Performance (%) | 2Q23 | YTD | 1 Year | 3 Years | 5 Years | 10 Years |
|---|---|---|---|---|---|---|
| Value Equity Composite (gross) | 4.56 | 8.63 | 13.97 | 13.49 | 10.32 | 12.47 |
| Value Equity Composite (net) | 4.51 | 8.50 | 13.69 | 13.21 | 10.01 | 12.13 |
| Russell 1000 Value Index | 4.07 | 5.12 | 11.54 | 14.30 | 8.10 | 9.21 |
| S&P 500 Index | 8.74 | 16.89 | 19.59 | 14.60 | 12.30 | 12.86 |

Source: FactSet
Past performance is not indicative of future results. Attribution results are based on sector returns which are gross of investment advisory fees. Attribution is based on performance that is gross of investment advisory fees and includes the reinvestment of income.
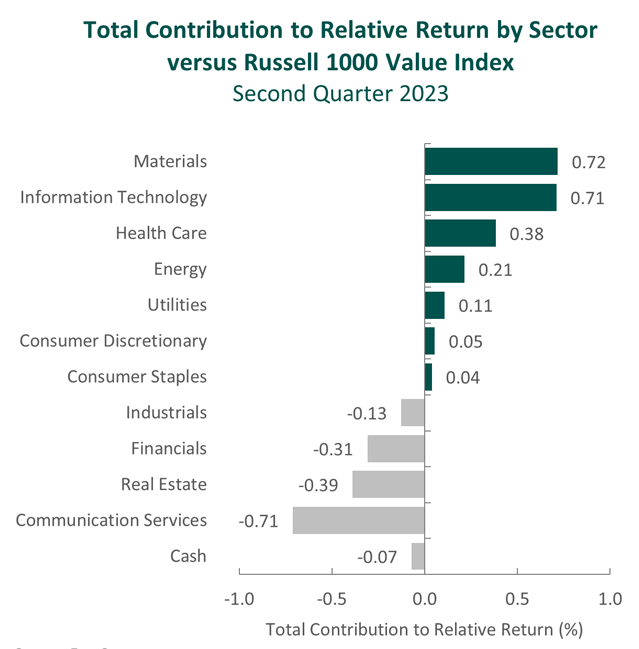
The portfolio’s outperformance relative to the Russell 1000 Value Index in the second quarter can be attributed to security selection, while allocation effects had a negative impact. Security selection in Materials, Information Technology and Health Care contributed the most to relative performance. Conversely, an underweight and security selection in Communication Services and security selection in Real Estate detracted. (Relative weights are the result of bottom-up security selection.)
Contributors and Detractors for 2Q 2023
| Relative Contributors | Relative Detractors |
|---|---|
| Martin Marietta Materials | Crown Castle |
| Adobe | Corteva |
| Microsoft | Cincinnati Financial |
| Lennar | Qualcomm |
| Parker Hannifin | Xcel Energy |
Aggregates producer Martin Marietta Materials was the top contributor for the period. In 2022 the company’s share price declined as the sharp rise in energy costs resulted in lower profit margins. Despite cost pressures and a stock price decline, in our view, fundamentals remained intact. We outlined in a previous commentary our confidence in management’s ability to navigate short-term setbacks given the company’s leading market position, geographically advantaged asset base and pricing power. Since then, management’s “value-over-volume” commercial strategy, the institution of multiple price increases and an improved cost structure have led to robust margin expansion and record first quarter results. We remain optimistic about the firm’s strategic plan, which emphasizes responsible growth through acquisitions, reinvestment in existing operations and the consistent return of capital to shareholders.
Parker Hannifin, the manufacturer of motion and control technologies, was a primary contributor during the quarter. In the latter half of 2022, the company closed on the acquisition of Meggitt. The cash transaction value of £7 billion (approximately $8.5 billion) was modest compared to the firm’s enterprise value of ~$50 billion, however a meaningful indication of management’s prowess. This, in our opinion, is a very well-timed combination, as Meggitt adds complementary aerospace and defense businesses to an already existing strong portfolio. It should also support Parker Hannifin’s goal of shifting its portfolio toward aftermarket exposure—a catalyst we had identified for the company—since aftermarket sales are typically higher margin and result in more predictable recurring revenues than original-equipment sales. Importantly, Parker Hannifin is no stranger to successful acquisitions, having integrated dozens (though mostly smaller than Meggitt) throughout its history. As such, we look forward to the prospect of the latest combination, further positioning the company to achieve new heights.
Crown Castle, the largest U.S. provider of shared communications infrastructure—cell towers, small cells and fiber—was the largest detractor from performance. The company reported a decline in fiber revenue and a deceleration in tower sales growth during the quarter after record network spending by wireless carriers in 2022 (related to the ongoing rollout of 5G). We continue to appreciate the benefits of management’s differentiated strategy to remain 100% focused on the U.S. while many competitors have instead sought to expand their tower businesses internationally. We believe Crown Castle’s approach delivers a compelling value proposition as the company’s customers seek to utilize shared infrastructure while making multi-billion-dollar investments in spectrum assets. Although carriers have generally pulled back from network spending this year, we continue to find the structure of Crown Castle’s tower business attractive. This includes the ability to implement a nearly 3% annual price escalator on tower rental rates, the low capital investment needed to maintain its towers and sticky customers with an over 95% renewal rate over the last 5 years. Looking past the short-term movements in demand, we believe that, over the long term, the company is well-poised to gain market share and also improve its profitability as it increases the average number of tenants per tower. In addition, management reiterated it is on pace to deploy 10,000 small cell nodes in 2023 (approximately doubling last year’s results). As such, we view Crown Castle as uniquely positioned to benefit from the shift to 5G networks, since the company’s portfolio skews toward urban areas where densification of populations, infrastructure and networks enhances the value proposition of small cells.
Qualcomm, a leading wireless communications technology company, was one of the largest detractors for the period. Weaker demand for handsets, elevated channel inventory and an underwhelming Chinese economic recovery resulted in a more difficult-than-expected short-term outlook. Qualcomm executives are navigating the short-term challenges by actively managing operating expenses. In recent years, despite threats of large clients developing in-house chips (e.g., Apple and Samsung), Qualcomm has been able to retain its high market share forged by a history of high spending in R&D and what we consider to be technological superiority. Longer term, we believe Qualcomm will continue to benefit from 5G penetration, as well as from the execution of its diversification strategy, as Internet of Things and Automotive remain attractive end markets. As the world continues on the path toward a proliferation of connectivity between varying devices (e.g., smart phones, tablets, wearable technology, Wi-Fi access points, factory automation and infotainment systems in autos), we are convinced the company is in a strong position to continue to win market share in both existing and new end markets, and to continue to return FREE cash flow to shareholders.
Recent Portfolio Activity
| Buys | Sells |
|---|---|
| Activision Blizzard | None |
During the quarter, we invested in Activision Blizzard.
Activision Blizzard, Inc.
Headquartered in Santa Monica, California, Activision Blizzard is one of the largest video game companies in the world. The company develops and sells games that are played by nearly 400 million monthly active users across 190 countries. Activision Blizzard is a product of the 2008 merger of Activision, the console game maker, and Blizzard Entertainment, the PC game maker. In 2015, Activision Blizzard also acquired King Digital Entertainment, the developer of mobile games. The combined entities own some of the most well-known franchises globally, including World of Warcraft, Call of Duty and Candy Crush.Together these three franchises account for roughly 80% of Activision Blizzard’s sales.
The company has successfully navigated multiple console cycles and, in recent years, has shifted its revenue mix away from physical sales toward more recurring sources. In 2013, roughly 70% of sales came from physical games, while today ~75% of sales come from subscriptions, in-game content and advertising across mobile devices, consolesand PCs.
In early 2022, Microsoft—a current Value Equity holding—announced its intention to acquire Activision Blizzard. Our subsequent discussions with Sony, also a current holding, furthered our understanding that access to Activision Blizzard’s gaming franchises is critical for PlayStation, Xbox and the broader videogame industry. We do not attempt to predict regulatory approval of the transaction and instead view the company as an optimal investment regardless of whether the acquisition takes place.
High-Quality Business
Some of the quality characteristics we have identified for Activision Blizzard include:
- Ability to develop and market enduring gaming franchises and monetize them over the long term via sequels and downloadable content;
- Dedicated user base and marketing scale which allow the firm to circumvent retailers and sell through direct online channels, driving higher gross margins and returns on invested capital; and
- Strong balance sheet and history of consistent FREE cash flow generation in an industry that is frequently unpredictable and hit-driven.
Attractive Valutaion
We estimate the company’s revenue and FREE cash flow to be higher on a normalized basis. As such, Activision Blizzard is currently offered at a discount to our estimates of intrinsic value. Microsoft, in fact, intends to acquire Activision Blizzard at a price of $95 per share—higher than the ~$84 share price at quarter end.
Compelling Catalysts
Catalysts we have identified for Activision Blizzard, which we believe will cause its stock price to appreciate over our three- to five-year investment horizon, include:
- Increased revenue from new products, such as free-to-play content, that rely on in-game transactions and advertising;
- The ability to leverage its wholly owned intellectual property for consoles and PCs, such as Call of Duty, into mobile games should improve sales; and
- Enhanced FREE cash flow generation as esports leagues and the firm’s live event capabilities are further improved.
Conclusion
At Aristotle Capital, we take a bottom-up approach to studying businesses. While macroeconomic factors such as inflation, monetary policy decisions and geopolitical conflicts may continue to dominate the current news cycle, we take a long-term perspective, attempting to identify, what we believe to be, high-quality companies that can successfully navigate periods of boom and bust. We spend very little time attempting to predict the outcome of macro or geopolitical events but rather spend considerable time attempting to identify businesses that are resilient. In our view, the fundamentals of a business are the most important determinants of its long-term stock price performance. Consequently, we believe the best way to consistently add value for our clients is to maintain a long-term view and focus on deeply understanding individual companies’ key attributes, value drivers and progress toward improvement.
1Source: Bank of America
2Source: FactSet earnings insight
The opinions expressed herein are those of Aristotle Capital Management, LLC (Aristotle Capital) and are subject to change without notice. Past performance is not a guarantee or indicator of future results. This material is not financial advice or an offer to purchase or sell any product. You should not assume that any of the securities transactions, sectors or holdings discussed in this report were or will be profitable, or that recommendations Aristotle Capital makes in the future will be profitable or equal the performance of the securities listed in this report. The portfolio characteristics shown relate to the Aristotle Value Equity strategy. Not every client’s account will have these characteristics. Aristotle Capital reserves the right to modify its current investment strategies and techniques based on changing market dynamics or client needs. There is no assurance that any securities discussed herein will remain in an account’s portfolio at the time you receive this report or that securities sold have not been repurchased. The securities discussed may not represent an account’s entire portfolio and, in the aggregate, may represent only a small percentage of an account’s portfolio holdings. The performance attribution presented is of a representative account from Aristotle Capital’s Value Equity Composite. The representative account is a discretionary client account which was chosen to most closely reflect the investment style of the strategy. The criteria used for representative account selection is based on the account’s period of time under management and its similarity of holdings in relation to the strategy. Recommendations made in the last 12 months are available upon request.
Returns are presented gross and net of investment advisory fees and include the reinvestment of all income. Gross returns will be reduced by fees and other expenses that may be incurred in the management of the account. Net returns are presented net of actual investment advisory fees and after the deduction of all trading expenses.
All investments carry a certain degree of risk, including the possible loss of principal. Investments are also subject to political, market, currency and regulatory risks or economic developments. International investments involve special risks that may in particular cause a loss in principal, including currency fluctuation, lower liquidity, different accounting methods and economic and political systems, and higher transaction costs. These risks typically are greater in emerging markets. Securities of small‐ and medium‐sized companies tend to have a shorter history of operations, be more volatile and less liquid. Value stocks can perform differently from the market as a whole and other types of stocks.
The material is provided for informational and/or educational purposes only and is not intended to be and should not be construed as investment, legal or tax advice and/or a legal opinion. Investors should consult their financial and tax adviser before making investments. The opinions referenced are as of the date of publication, may be modified due to changes in the market or economic conditions, and may not necessarily come to pass. Information and data presented has been developed internally and/or obtained from sources believed to be reliable. Aristotle Capital does not guarantee the accuracy, adequacy or completeness of such information.
Aristotle Capital Management, LLC is an independent registered investment adviser under the Advisers Act of 1940, as amended. Registration does not imply a certain level of skill or training. More information about Aristotle Capital, including our investment strategies, fees and objectives, can be found in our ADV Part 2, which is available upon request. ACM-2307-27


Composite returns for all periods ended June 30, 2023 are preliminary pending final account reconciliation.
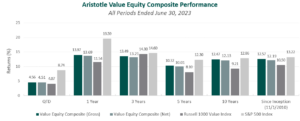
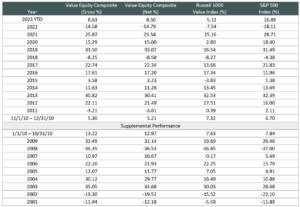
Past performance is not indicative of future results. The information provided should not be considered financial advice or a recommendation to purchase or sell any particular security or product. Performance results for periods greater than one year have been annualized. The Aristotle Value Equity strategy has an inception date of November 1, 2010; however, the strategy initially began at Mr. Gleicher’s predecessor firm in October 1997. A supplemental performance track record from January 1, 2001 through October 31, 2010 is provided above. The returns are based on two separate accounts and performance results are based on custodian data. During this time, Mr. Gleicher had primary responsibility for managing the two accounts. Mr. Gleicher began managing one account in November 2000 and the other December 2000.
Returns are presented gross and net of investment advisory fees and include the reinvestment of all income. Gross returns will be reduced by fees and other expenses that may be incurred in the management of the account. Net returns are presented net of actual investment advisory fees and after the deduction of all trading expenses.
The Russell 1000 Value® Index measures the performance of the large cap value segment of the U.S. equity universe. It includes those Russell 1000 Index companies with lower price-to-book ratios and lower expected growth values. The S&P 500® Index is the Standard & Poor’s Composite Index of 500 stocks and is a widely recognized, unmanaged index of common stock prices. The Russell 1000® Growth Index measures the performance of the large cap growth segment of the U.S. equity universe. It includes those Russell 1000 companies with higher price-to-book ratios and higher forecasted growth values. The Russell 2000® Index measures the performance of the small cap segment of the U.S. equity universe. The Russell 2000 Index is a subset of the Russell 3000® Index representing approximately 10% of the total market capitalization of that index. It includes approximately 2,000 of the smallest securities based on a combination of their market cap and current index membership. The Dow Jones Industrial Average® is a price-weighted measure of 30 U.S. blue-chip companies. The Index covers all industries except transportation and utilities. The NASDAQ Composite Index measures all NASDAQ domestic and international based common type stocks listed on The NASDAQ Stock Market. The NASDAQ Composite includes over 3,000 companies, more than most other stock market indexes. The Bloomberg U.S. Aggregate Bond Index is an unmanaged index of domestic investment grade bonds, including corporate, government and mortgage-backed securities. The WTI Crude Oil Index is a major trading classification of sweet light crude oil that serves as a major benchmark price for oil consumed in the United States. The 3-Month U.S. Treasury Bill is a short-term debt obligation backed by the U.S. Treasury Department with a maturity of three months. Consumer Price Index is a measure of the average change over time in the prices paid by urban consumers for a market basket of consumer goods and services. The volatility (beta) of the Composite may be greater or less than its respective benchmarks. It is not possible to invest directly in these indexes.

