Commentary
Value Equity 1Q 2024
Markets Review

Sources: CAPS CompositeHubTM, Bloomberg
Past performance is not indicative of future results. Aristotle Value Equity Composite returns are presented gross and net of investment advisory fees and include the reinvestment of all income. Gross returns will be reduced by fees and other expenses that may be incurred in the management of the account. Net returns are presented net of actual investment advisory fees and after the deduction of all trading expenses. Aristotle Capital Composite returns are preliminary pending final account reconciliation. Please see important disclosures at the end of this document.
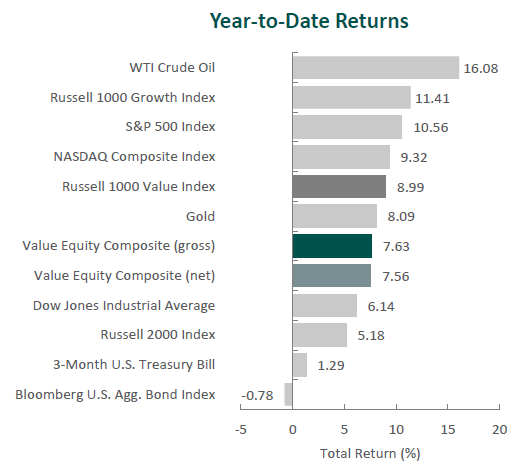
The U.S. equity market continued to rally, as the S&P 500 Index rose 10.56% during the period. Concurrently, the Bloomberg U.S. Aggregate Bond Index fell, returning -0.78% for the quarter. In terms of style, the Russell 1000 Value Index underperformed its growth counterpart by 2.42%.
Gains were broad-based, as ten out of the eleven sectors within the Russell 1000 Value Index finished higher. Energy, Financials and Industrials were the best-performing sectors. Meanwhile, Real Estate was the only sector to post a negative return, and Utilities and Health Care gained the least.
U.S. economic growth remained positive, as real GDP increased at an annual rate of 3.4% in the fourth quarter, though less than the third quarter’s 4.9% reading. The composition of growth was broad-based, having been driven by consumer spending, state and local government investment, and exports. In more recent data, consumer spending increased 0.8% month-over-month in February—the largest gain since January 2023—while housing starts surged 11.6%, touching the highest level in nearly two years. Furthermore, the labor market remained resilient, with unemployment at 3.9% and real average hourly earnings increasing 1.1% year-over-year in February. Meanwhile, inflation, though lower than its level at the end of last year, slightly increased during the quarter, as annual CPI rose from 3.1% in January to 3.2% in February.
Due to continued steady economic growth, the strength of the labor market and higher-than-expected inflation data, the Federal Reserve (Fed) maintained the benchmark federal funds rate’s targeted range of 5.25% to 5.50% for the fifth consecutive meeting. Chair Powell reaffirmed that the policy rate is likely at its peak for this tightening cycle, but also emphasized that reducing policy restraint too soon or too much could reverse the progress already made by the central bank. However, most recent committee projections indicate that the federal funds rate will be at 4.60% at the end of this year and it will soon be appropriate to slow the pace of the Fed’s balance-sheet runoff.
On the corporate earnings front, results were mixed, as S&P 500 companies reported earnings growth of 4.0%, the second straight quarter of year-over-year growth, but fewer companies exceeded EPS estimates compared to the previous period. Inflation continued to be a major talking point, but companies reported resilient consumer spending, leading to fewer mentions of a potential recession on earnings calls.
Lastly, in U.S. politics, Congress passed, and President Biden signed the $1.2 trillion spending package that will fund the government for the rest of the fiscal year. In election news, both President Biden and former President Trump secured enough delegates to clinch their parties’ respective nominations, setting up the first presidential rematch in nearly 70 years.
Performance and Attribution Summary
For the first quarter of 2024, Aristotle Capital’s Value Equity Composite posted a total return of 7.63% gross of fees (7.56% net of fees), underperforming the 8.99% return of the Russell 1000 Value Index and the 10.56% return of the S&P 500 Index. Please refer to the table for detailed performance.
| Performance (%) | 1Q24 | 1 Year | 3 Years | 5 Years | 10 Years |
|---|---|---|---|---|---|
| Value Equity Composite (gross) | 7.63 | 24.93 | 8.24 | 13.85 | 12.18 |
| Value Equity Composite (net) | 7.56 | 24.62 | 7.97 | 13.55 | 11.84 |
| Russell 1000 Value Index | 8.99 | 20.27 | 8.10 | 10.30 | 9.00 |
| S&P 500 Index | 10.56 | 29.88 | 11.48 | 15.03 | 12.95 |

Source: FactSet
Past performance is not indicative of future results. Attribution results are based on sector returns which are gross of investment advisory fees. Attribution is based on performance that is gross of investment advisory fees and includes the reinvestment of income.
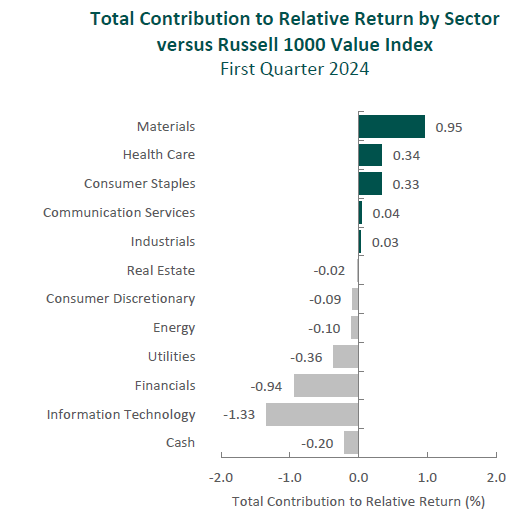
The portfolio’s underperformance relative to the Russell 1000 Value Index in the first quarter can be attributed to both security selection and allocation effects. Security selection in Information Technology, Financials and Utilities detracted the most from relative performance. Conversely, security selection in Materials, Consumer Staples and Health Care contributed. (Relative weights are the result of bottom-up security selection.)
Contributors and Detractors for 1Q 2024
| Relative Contributors | Relative Detractors |
|---|---|
| Parker Hannifin | Adobe |
| Martin Marietta Materials | Sony |
| Corteva | ANSYS |
| Lennar | Xcel Energy |
| Ameriprise Financial | Equity Lifestyle Properties |
Adobe, the content creation and publishing software provider, was the leading detractor for the quarter.The company continues to benefit from its shift to a subscription model, with almost 95% of its record $19.4 billion in fiscal year 2023 revenue coming from subscriptions, while continuing to invest in innovation that expands its addressable market. Nevertheless, investors seem concerned with some of the lower-cost alternatives entering the market, including Sora, an OpenAI platform that produces videos from text. While much attention has also been placed on Adobe’s Firefly, a generative AI service that has already produced more than 6.5 billion images since launch in March 2023, we will take our time to understand Adobe’s AI monetization strategy. In the meantime, we continue to believe that the combination of Express, Firefly, Creative Cloud, Acrobat and Experience Cloud provides a unique solution to address all the content and data needs of clients and their management of the customer experience. In addition to innovation, Adobe continues to generate and return cash to shareholders, exemplified most recently by its new $25 billion stock repurchase program.
Xcel Energy, one of the largest renewable energy owners among regulated utilities, was a primary detractor during the period. Shares fell as the company’s facilities appear to have been involved in an ignition of the largest wildfire in Texas state history. As a result, insurance companies have begun filing lawsuits claiming Xcel should be held liable for damages related to the more than one million acres burned. Though the magnitude and likelihood of settlements are difficult to quantify, we believe potential payouts would be meaningfully less than the over $5 billion in market value the company lost in the days following the news. We will continue to closely monitor the situation and its impact on the company, as a full investigation is still underway. Over the long term, our conviction remains that Xcel is well positioned to benefit from increased demand for clean energy, as its service territories have what we believe to be some of the best wind and solar resources in the country.
Aggregates producer Martin Marietta Materials was a top contributor for the period.As a result of the company’s successful execution of its value-over-volume commercial strategy, including 15% price increases in its aggregates business, Martin Marietta reported full-year records for revenues and profitability. Furthermore, the company continues to bolster its leadership position through the acquisitions of Albert Frei & Sons, a leading aggregates producer in Colorado, and the southeast aggregates operations of Blue Water Industries. These transactions are expected to add one billion tons of reserves, improve product mix and profitability, and allow for the expansion into new target markets such as Nashville and Miami. We believe Martin Marietta is well positioned to continue executing on its catalysts, including optimizing its product portfolio and further enhancing profitability from both pricing and operations initiatives, all while benefiting from continued increases in both non-residential construction and government spending.
Corteva, the seed and crop protection company, was one of the largest contributors. As discussed in last quarter’s commentary, we believed the crop protection business was at or near a cyclical bottom in 2023, as customer destocking followed a 2020-2022 period of robust orders. Share prices have subsequently risen with Corteva’s crop protection sales falling just 5% in the previous quarter, an improved result compared to the 9% full-year decline, accompanied by guidance calling for a return to growth in the second half of 2024. However, as long-term investors, we look past cyclical fluctuations and are encouraged as Corteva further executes on many of the catalysts we identified. These include continued innovation (with over 400 new product launches in 2023) and share gains for the company’s Enlist E3 soybeans, which achieved 58% market penetration in 2023 and became the top-selling soybean technology in the U.S.
Recent Portfolio Activity
| Buys | Sells |
|---|---|
| Lowe’s Companies | Phillips 66 |
| TotalEnergies | Sysco |
During the quarter, we sold our positions in Phillips 66 and Sysco and invested in two new positions: Lowe’s Companies and TotalEnergies.
We first purchased Phillips 66, the energy manufacturing and logistics company, in the third quarter of 2012. During our over decade-long ownership period, the company transformed itself from a predominately refining operation to a significantly more diversified energy business. In 2012, refining represented nearly 75% of earnings, and today it is less than half. With the expansion of other businesses, including midstream which is underpinned by long-term fee-based contracts, as well as chemicals and marketing, we believe Phillips 66 has reduced its cyclicality while enhancing FREE cash flow generation, supporting increased returns to shareholders. In addition, the company has started to position itself for the energy transition and remains on track to convert its San Francisco refinery into one of the world’s largest renewable fuels facilities. While we continue to believe Phillips 66 is a high-quality company on the path to further improvement, we decided to sell our shares to fund the purchase of what we consider a more suitable and attractive investment in TotalEnergies (discussed below).
We have owned Sysco, one of the largest food distribution companies in the world, since the fourth quarter of 2022. During our holding period, Sysco’s CEO Kevin Hourican has made progress transforming various aspects of the business, including implementing new technologies able to assist customers with their own changing menus and needs. Through leveraging its scale and purchasing power, we continue to view Sysco as well positioned to gain further share of the highly fragmented U.S. food distribution market, all while sustaining its more than 50-year streak of increasing dividends. Though the company meets each of our criteria for investment, we decided it was the best candidate for sale to fund the purchase of Lowe’s Companies, which we believe is a more optimal investment.
Lowe’s Companies, Inc.
Based in North Carolina, and with a history dating back to 1921, Lowe’s Companies is the world’s second-largest home improvement retailer (after Home Depot). The company operates more than 1,700 stores in the United States that offer a wide variety of products to enhance a home, from plants for the garden and house décor to hardware and appliances. Often located in suburban areas, Lowe’s stores primarily serve retail “do-it-yourself” customers (~75% of revenue) and sell products that are used for home maintenance and repair (over 60% of revenue). This contrasts with Home Depot, whose stores have a higher presence in metropolitan areas and cater more to professional customers.
We had previously been investors in Home Depot. Over much of the past decade Home Depot had, in our opinion, executed better than Lowe’s—expanding its presence with large professional customers and increasing its store productivity. However, with Lowe’s hiring of former Home Depot executive Marvin Ellison in 2018, we believe Lowe’s has started the process of closing the gap to better compete with its nearest rival.
High-Quality Business
Some of the quality characteristics we have identified for Lowe’s include:
- Economies of scale and Lowe’s extensive store network allow for cost and procurement advantages—i.e., significant bargaining power with vendors and suppliers;
- Difficult-to-replicate knowledge and expertise of Lowe’s associates create a differentiated experience for customers, contributing to the company’s ~10% share of the highly fragmented home improvement market;
- Home improvement is one of the few retailing businesses that hasn’t been disrupted in a large way by online competition (namely Amazon), which should continue given products are either costly to ship or needed immediately (i.e., replacing a broken tool or buying more material necessary to complete a project); and
- Strong brand awareness and the ability to serve as a one-stop shop for any home improvement need creates a positive flywheel effect, promoting customer loyalty and in turn driving further scale benefits.
Attractive Valutaion
We believe shares of Lowe’s are attractively valued given our estimates of normalized earnings. More specifically, our analysis indicates that Lowe’s opportunity to gain market share and enhance profitability is underappreciated by the market.
Compelling Catalysts
Catalysts we have identified for Lowe’s, which we believe will propel the business forward over our three- to five-year investment horizon include:
- Market share gains through improvements to Lowe’s supply chains, upgraded IT systems and enhanced omnichannel sales, which include “buy online, pick up in store” purchases;
- Increased share gains with professionals due to the company’s renewed focus on offering products and services for this larger-scale customer base (Lowe’s estimates a professional make ~70 store visits per year versus just ~4 per year for a “do-it-yourself” customer); and
- Increased profitability and sales per square foot of retail space, as the company has shifted its focus from geographical expansion toward improving store efficiency.
TotalEnergies S.E.
Headquartered in Paris, France, TotalEnergies was founded in 1924 and is one of the world’s largest energy companies. The company operates in more than 130 countries and spans the entire energy value chain, producing and marketing oil and biofuels, liquid natural gas (LNG), renewables and electricity.
To meet the challenge of the energy transition and still ensure reliable energy in the short term, TotalEnergies has implemented a two-pillar strategy: on one end, the company continues to develop low-cost exploration and production projects, with LNG playing a vital role in the transition; on the other, it has been building its Integrated Power segment through investments in renewable power. As such, management plans to invest over 30% of total spending in low-carbon businesses and rank among the world’s top five providers of solar and wind energy by 2030. To emphasize this ambition, the company changed its name from Total to TotalEnergies in 2021.
High-Quality Business
Some of the quality characteristics we have identified for TotalEnergies include:
- Low-cost and geographically diversified portfolio of upstream assets;
- Commitment to research and development focused on clean energy sources (e.g., LNG, solar, wind);
- Well-diversified business mix provides balance during periods of hydrocarbon price volatility; and
- Experienced management team focused on cost discipline and FREE cash flow generation.
Attractive Valutaion
Using our estimates of normalized earnings, we believe TotalEnergies’ current stock price is offered at a discount to the company’s intrinsic value.
Compelling Catalysts
Catalysts we have identified for TotalEnergies, which we believe will cause its stock price to appreciate over our three- to five-year investment horizon, include:
- Uniquely positioned to benefit from increased global demand for clean energy;
- Increased FREE cash flow and ROIC, as traditional exploration and production assets are used to fund short-cycle projects and as profitability in Integrated Power increases over the coming years;
- Further ability of TotalEnergies’ LNG trading business to capture volatility in markets given the company’s global footprint and vast portfolio; and
- Continued divestment of non-core assets as the company focuses on advantaged, low-cost and low-emission projects.
Conclusion
Despite the U.S. economy’s continued expansion, economic data points remain mixed. Additionally, investors face uncertainty the rest of the year, whether it be the path of central bank policy, the outcome of the 2024 U.S. presidential election, or the potential for new and/or escalating geopolitical conflicts.
However, while our analysis considers long-term developments in the macroeconomy, we focus most of our time and attention on individual companies that, in our opinion, possess a combination of qualities that are sustainable and difficult to reproduce. It is our belief that a diversified portfolio of investments in these companies will thrive over full market cycles.
The opinions expressed herein are those of Aristotle Capital Management, LLC (Aristotle Capital) and are subject to change without notice. Past performance is not a guarantee or indicator of future results. This material is not financial advice or an offer to purchase or sell any product. You should not assume that any of the securities transactions, sectors or holdings discussed in this report were or will be profitable, or that recommendations Aristotle Capital makes in the future will be profitable or equal the performance of the securities listed in this report. The portfolio characteristics shown relate to the Aristotle Value Equity strategy. Not every client’s account will have these characteristics. Aristotle Capital reserves the right to modify its current investment strategies and techniques based on changing market dynamics or client needs. There is no assurance that any securities discussed herein will remain in an account’s portfolio at the time you receive this report or that securities sold have not been repurchased. The securities discussed may not represent an account’s entire portfolio and, in the aggregate, may represent only a small percentage of an account’s portfolio holdings. The performance attribution presented is of a representative account from Aristotle Capital’s Value Equity Composite. The representative account is a discretionary client account which was chosen to most closely reflect the investment style of the strategy. The criteria used for representative account selection is based on the account’s period of time under management and its similarity of holdings in relation to the strategy. Recommendations made in the last 12 months are available upon request.
Returns are presented gross and net of investment advisory fees and include the reinvestment of all income. Gross returns will be reduced by fees and other expenses that may be incurred in the management of the account. Net returns are presented net of actual investment advisory fees and after the deduction of all trading expenses.
All investments carry a certain degree of risk, including the possible loss of principal. Investments are also subject to political, market, currency and regulatory risks or economic developments. International investments involve special risks that may in particular cause a loss in principal, including currency fluctuation, lower liquidity, different accounting methods and economic and political systems, and higher transaction costs. These risks typically are greater in emerging markets. Securities of small‐ and medium‐sized companies tend to have a shorter history of operations, be more volatile and less liquid. Value stocks can perform differently from the market as a whole and other types of stocks.
The material is provided for informational and/or educational purposes only and is not intended to be and should not be construed as investment, legal or tax advice and/or a legal opinion. Investors should consult their financial and tax adviser before making investments. The opinions referenced are as of the date of publication, may be modified due to changes in the market or economic conditions, and may not necessarily come to pass. Information and data presented has been developed internally and/or obtained from sources believed to be reliable. Aristotle Capital does not guarantee the accuracy, adequacy or completeness of such information.
Aristotle Capital Management, LLC is an independent registered investment adviser under the Advisers Act of 1940, as amended. Registration does not imply a certain level of skill or training. More information about Aristotle Capital, including our investment strategies, fees and objectives, can be found in our ADV Part 2, which is available upon request. ACM-2404-14

Sources: CAPS CompositeHubTM, Russell Investments, Standard & Poor’s

Composite returns for all periods ended March 31, 2024 are preliminary pending final account reconciliation.
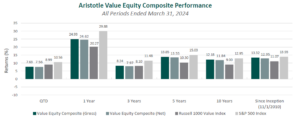
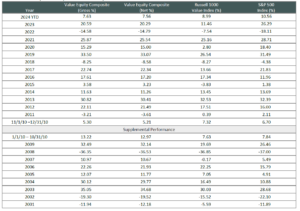
Past performance is not indicative of future results. The information provided should not be considered financial advice or a recommendation to purchase or sell any particular security or product. Performance results for periods greater than one year have been annualized. The Aristotle Value Equity strategy has an inception date of November 1, 2010; however, the strategy initially began at Mr. Gleicher’s predecessor firm in October 1997. A supplemental performance track record from January 1, 2001 through October 31, 2010 is provided above. The returns are based on two separate accounts and performance results are based on custodian data. During this time, Mr. Gleicher had primary responsibility for managing the two accounts, one account starting in November 2000 and the other December 2000.
Returns are presented gross and net of investment advisory fees and include the reinvestment of all income. Gross returns will be reduced by fees and other expenses that may be incurred in the management of the account. Net returns are presented net of actual investment advisory fees and after the deduction of all trading expenses.
The Russell 1000 Value® Index measures the performance of the large cap value segment of the U.S. equity universe. It includes those Russell 1000 Index companies with lower price-to-book ratios and lower expected growth values. The S&P 500® Index is the Standard & Poor’s Composite Index of 500 stocks and is a widely recognized, unmanaged index of common stock prices. The Russell 1000® Growth Index measures the performance of the large cap growth segment of the U.S. equity universe. It includes those Russell 1000 companies with higher price-to-book ratios and higher forecasted growth values. The Russell 2000® Index measures the performance of the small cap segment of the U.S. equity universe. The Russell 2000 Index is a subset of the Russell 3000® Index representing approximately 10% of the total market capitalization of that index. It includes approximately 2,000 of the smallest securities based on a combination of their market cap and current index membership. The Dow Jones Industrial Average® is a price-weighted measure of 30 U.S. blue-chip companies. The Index covers all industries except transportation and utilities. The NASDAQ Composite Index measures all NASDAQ domestic and international based common type stocks listed on The NASDAQ Stock Market. The NASDAQ Composite includes over 3,000 companies, more than most other stock market indexes. The Bloomberg U.S. Aggregate Bond Index is an unmanaged index of domestic investment grade bonds, including corporate, government and mortgage-backed securities. The WTI Crude Oil Index is a major trading classification of sweet light crude oil that serves as a major benchmark price for oil consumed in the United States.. The 3-Month U.S. Treasury Bill is a short-term debt obligation backed by the U.S. Treasury Department with a maturity of three months. The Consumer Price Index is a measure of the average change over time in the prices paid by urban consumers for a market basket of consumer goods and services. The volatility (beta) of the Composite may be greater or less than its respective benchmarks. It is not possible to invest directly in these indexes.


