Commentary
Value Equity 1Q 2023
Markets Review

Sources: SS&C Advent, Bloomberg
Past performance is not indicative of future results. Aristotle Value Equity Composite returns are presented gross and net of investment advisory fees and include the reinvestment of all income. Gross returns will be reduced by fees and other expenses that may be incurred in the management of the account. Net returns are presented net of actual investment advisory fees and after the deduction of all trading expenses. Aristotle Capital Composite returns are preliminary pending final account reconciliation. Please see important disclosures at the end of this document.
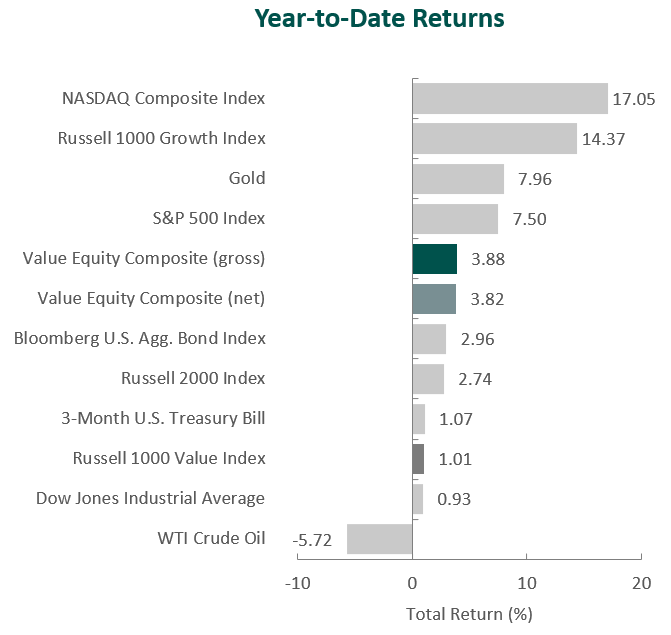
The U.S. equity market finished higher for the first quarter of the year, as the S&P 500 Index rose 7.50% during the period. Concurrently, the Bloomberg U.S. Aggregate Bond Index increased 2.96% for the quarter. In terms of style, the Russell 1000 Growth Index outperformed its value counterpart by 13.36% during the quarter.
Seven out of the eleven sectors within the Russell 1000 Value Index finished higher for the quarter, with Communication Services, Information Technology and Consumer Discretionary gaining the most. Meanwhile, Health Care, Financials and Energy were the worst-performing sectors.
Although inflation remained well above its historical average of 3.26%, the pace of price increases moderated during the quarter. As such, for the 12-month periods ending in January and February, annualized CPI figures declined from 6.4% to 6.0%, respectively. The pattern of disinflation was partly driven by decreases in the price of fuel, used vehicles and medical care services. The government also reported a deceleration in U.S. economic growth, as GDP increased 2.6% in the fourth quarter following the third quarter’s 3.2% increase. Weaker consumer spending and business investment were significant factors in the softer results. However, retail sales in January jumped 3%, and the labor market remained tight, with an unemployment rate of 3.6%.
While some economic data points trended in a positive direction, the market was shocked with the regulatory shutdown of Silicon Valley Bank (SVB), the second-largest bank failure by assets in U.S. history. The value of SVB’s bond holdings had plunged amid rapidly increasing interest rates, creating a shortfall as clients (largely composed of tech startups) withdrew their deposits, eventually leading to a run on the bank’s deposits. Just days later, regulators also took control of New York-based Signature Bank. The speed and size of the bank failures sent U.S. bank share prices tumbling. To provide stability, the Federal Reserve announced the creation of an emergency lending facility that would allow banks to deposit high-quality assets (e.g., Treasuries and mortgage-backed securities) in exchange for a cash advance worth the face value of the asset (instead of the market value). Additionally, First Citizens Bank announced that it had made an agreement with the Federal Deposit Insurance Corporation (FDIC) for a whole bank purchase with loss share coverage of Silicon Valley Bridge Bank.
Despite the turmoil in the banking system, the Federal Reserve (Fed) stayed its course, increasing its benchmark rate by 0.25% in March (its ninth consecutive rate hike) to a range of 4.75% to 5.00%. However, noting that banking events may contribute to a more restrictive credit environment, the Fed tempered its stance that further rate increases are necessary to restore price stability and achieve its 2% inflation target. Rather, Fed Chair Powell emphasized the reliance on incoming data to inform the future path of monetary policy, as conditions may have tightened more than economic indices currently suggest.
On the corporate earnings front, results and guidance were broadly underwhelming, with only 68% of S&P 500 companies exceeding EPS estimates (below the five-year average of 77%) and 67% of companies providing negative EPS guidance (above the five-year average of 59%). Overall, the S&P 500 companies reported a decline in earnings of 4.9% as inflation and recession remained prevalent topics, with 332 and 148 companies mentioning those words on earnings calls, respectively. Nevertheless, in spite of the weaker-than-expected results, there have also been positive remarks of cost cutting, moderating input price pressures and better supply-chain dynamics.
Performance and Attribution Summary
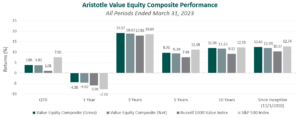
For the first quarter of 2023, Aristotle Capital’s Value Equity Composite posted a total return of 3.88% gross of fees (3.82% net of fees), outperforming the 1.01% return of the Russell 1000 Value Index and underperforming the 7.50% return of the S&P 500 Index. Please refer to the table for detailed performance.
| Performance (%) | 1Q23 | 1 Year | 3 Years | 5 Years | 10 Years |
|---|---|---|---|---|---|
| Value Equity Composite (gross) | 3.88 | -4.38 | 19.17 | 9.70 | 11.98 |
| Value Equity Composite (net) | 3.82 | -4.62 | 18.87 | 9.39 | 11.63 |
| Russell 1000 Value Index | 1.01 | -5.91 | 17.93 | 7.49 | 9.12 |
| S&P 500 Index | 7.50 | -7.73 | 18.60 | 11.18 | 12.23 |

Source: FactSet
Past performance is not indicative of future results. Attribution results are based on sector returns which are gross of investment advisory fees. Attribution is based on performance that is gross of investment advisory fees and includes the reinvestment of income.
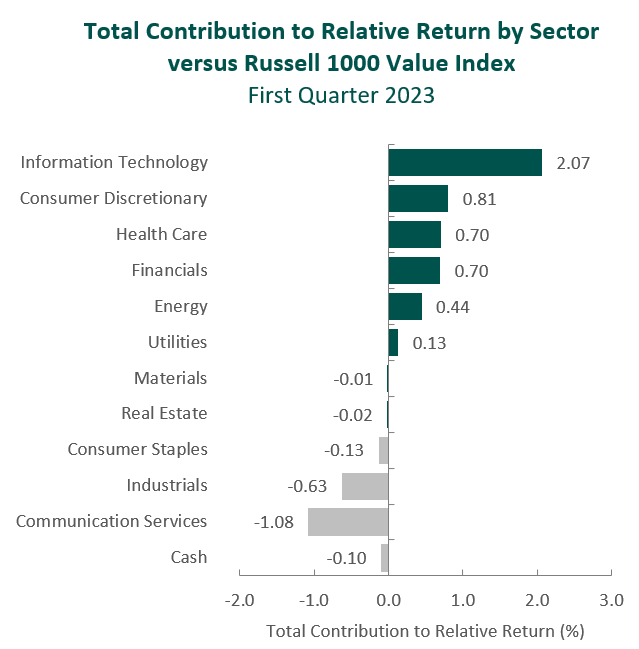
The portfolio’s outperformance relative to the Russell 1000 Value Index in the first quarter can be attributed to both security selection and allocation effects. An overweight in Information Technology and security selection in Consumer Discretionary and Information Technology contributed the most to relative performance. Conversely, an underweight in Communication Services and security selection in Industrials and Materials detracted. (Relative weights are the result of bottom-up security selection.)
Contributors and Detractors for 1Q 2023
| Relative Contributors | Relative Detractors |
|---|---|
| ANSYS | Cullen/Frost Bankers |
| Microsoft | PNC Financial Services |
| Microchip Technology | RPM International |
| Lennar | Honeywell |
| Sony | Commerce Bancshares |
ANSYS, an industry leader in engineering simulation software, was the top contributor during the quarter. The company reported strong results, with its annual contract value (ACV) advancing 14% to $2 billion in 2022, supported by broad-based growth across all major industries and geographies. This, in our opinion, exemplifies the significant value ANSYS’s software provides, enabling its customers (that include automotive, aerospace, consumer goods, energy and health care firms) to save time and money by testing products before the design process is complete. The applications for ANSYS’s software suite have expanded over the years, as even the simplest products have increased in complexity, continuously elevating the need for simulation. Meanwhile, the market for ANSYS products remains underpenetrated, with only a fraction of design engineers currently utilizing simulation software. Given the scale of its user base, high switching costs, network effects, technological leadership and overall reputation across many disciplines (from fluid dynamics to electromagnetics), we believe the company is uniquely positioned to further increase its market share, as simulation becomes more ubiquitous across industries and product types.
Lennar, one of the nation’s largest homebuilders, was a primary contributor for the quarter. Following a housing surge supported by low mortgage rates and government stimulus, U.S. home sales activity began to decline in 2022 as rapidly rising mortgage rates reduced affordability. Over our decade-plus investment in Lennar, we have admired the management team’s ability to quickly respond to changing housing dynamics. Recent times were no exception, as Lennar adopted a dynamic pricing model that, in combination with its digital-marketing platform, helped to protect its backlog and prevent cancellations. As a result, fiscal first-quarter orders declined 10% year-over-year compared to a 38% decline for the homebuilder industry. The company has also made progress on its transition to a lighter asset strategy, a catalyst we previously identified, now controlling 68% of its land through options (up from 39% in 2020). Less capital tied up in land and the ability to acquire parcels on a just-in-time basis, in our opinion, should support enhanced FREE cash flow generation. As such, we believe Lennar’s strong balance sheet, prudent inventory management and further ability to implement cost and production efficiencies position it well to both overcome near-term housing market softness and benefit from the decade-long undersupply of homes in the U.S.
Cullen/Frost Bankers, the Texas-based bank, was the largest detractor for the period. Given the heightened levels of uncertainty after the collapse of SVB and Signature Bank, regional banks were scrutinized as potential vulnerabilities within the U.S. banking system. Despite the recent events, we remain confident in Cullen/Frost’s ability to withstand short-term volatility based on its long and proven history and strong capital position. Since the company’s inception in 1868, Cullen/Frost has employed a conservative strategy and a client service-centric model that allowed it to be the only Texas bank to survive the 1980s Texas banking collapse, oil crisis and real estate market crash without federal assistance or a takeover, and it was also the first bank to decline TARP (Troubled Asset Relief Program) bailout funds during the Global Financial Crisis of 2008. Cullen/Frost continues to utilize this strategy, with a relatively low loan-to-deposit ratio of 38% and current capital ratios in excess of well-capitalized levels. The company’s strong balance sheet management and steady, relationship-based approach have led to consistent levels of profitability and 29 consecutive years of dividend increases. We believe Cullen/Frost remains in a strong position to navigate the current short-term environment, continue to win market share in areas such as Houston and Dallas, and generate returns for shareholders in the long run.
RPM International, the coatings, sealants and building materials manufacturer, was one of the biggest detractors for the quarter. The combination of higher interest rates (which have negatively impacted construction activity and existing home sales), temporarily moderating customer purchases and cost inflation has weighed on the company and the overall coatings industry. Despite the challenging short-term macroeconomic landscape, RPM continues to demonstrate fundamental improvement. In response to inflation, the company has successfully increased pricing while simultaneously launching and executing on its latest Margin Achievement Plan (MAP 2025), which aims to make operational improvements by optimizing RPM’s manufacturing footprint, expanding categories of centralized procurement and executing on value-added selling. We believe the company’s ongoing focus on operational efficiency should allow it to continue to enhance its long-term FREE cash flow generation, which it can use to innovate new products and opportunistically deploy capital in the form of accretive acquisitions or returning value back to shareholders, as demonstrated by RPM’s ability to increase its dividend for 49 consecutive years.
Recent Portfolio Activity
During the quarter, we exited our investment in PayPal Holdings.
We first invested in PayPal, the online and mobile e-commerce payments company, during the third quarter of 2015. Over the past decade, we have studied PayPal’s ability to grow its extensive dual network (difficult to replicate, in our opinion) while navigating numerous competitors entering the industry.
| Buys | Sells |
|---|---|
| None | PayPal Holdings |
During our ownership period, the company has increased its payment volumes and made progress on many of its strategic initiatives, including adding partnerships with various companies (e.g., Walmart and American Express). We believe this has made the company a stronger force in the payments ecosystem. More recently, PayPal has shifted from its prior strategy of growing its user base to instead focusing on increasing transactions per user. The company has also seen an ongoing mix shift away from the PayPal branded checkout business toward its non-branded business Braintree. The non-branded business has a lower take rate, as its customers are primarily large enterprises (like Uber, Airbnb and Live Nation) with which bespoke rates are negotiated. In addition, PayPal has experienced recent leadership changes, including the 2022 departure of then-CFO John Rainey and CEO Dan Schulman’s announced retirement at the end of 2023. We will continue our research on the payments business and take our time to better understand these transitions. In the meantime, we decided PayPal was the best candidate for sale to fund the purchase of a what we believe to be a more optimal investment (which we will discuss at a later date).
Conclusion
A core tenet of our investment philosophy is the commitment to understand businesses with a long-term perspective. For us, this is especially important during times of heightened uncertainty when macroeconomic events dominate headlines. We remain aware of short-term topics such as inflation, monetary policy and the recent shock to the banking system. However, we believe a competitive advantage of our investment process lies in the fact that, instead of reacting and repositioning our portfolio based on unknowns and unfolding events, our focus remains on business fundamentals. Fundamentals, we are convinced, are what dictate shareholder value in the long term. As such, we continue to attentively study what we believe are high-quality companies with sustainable competitive advantages poised to outperform their peers over full market cycles.
The opinions expressed herein are those of Aristotle Capital Management, LLC (Aristotle Capital) and are subject to change without notice. Past performance is not a guarantee or indicator of future results. This material is not financial advice or an offer to purchase or sell any product. You should not assume that any of the securities transactions, sectors or holdings discussed in this report were or will be profitable, or that recommendations Aristotle Capital makes in the future will be profitable or equal the performance of the securities listed in this report. The portfolio characteristics shown relate to the Aristotle Value Equity strategy. Not every client’s account will have these characteristics. Aristotle Capital reserves the right to modify its current investment strategies and techniques based on changing market dynamics or client needs. There is no assurance that any securities discussed herein will remain in an account’s portfolio at the time you receive this report or that securities sold have not been repurchased. The securities discussed may not represent an account’s entire portfolio and, in the aggregate, may represent only a small percentage of an account’s portfolio holdings. The performance attribution presented is of a representative account from Aristotle Capital’s Value Equity Composite. The representative account is a discretionary client account which was chosen to most closely reflect the investment style of the strategy. The criteria used for representative account selection is based on the account’s period of time under management and its similarity of holdings in relation to the strategy. Recommendations made in the last 12 months are available upon request.
Returns are presented gross and net of investment advisory fees and include the reinvestment of all income. Gross returns will be reduced by fees and other expenses that may be incurred in the management of the account. Net returns are presented net of actual investment advisory fees and after the deduction of all trading expenses.
All investments carry a certain degree of risk, including the possible loss of principal. Investments are also subject to political, market, currency and regulatory risks or economic developments. International investments involve special risks that may in particular cause a loss in principal, including currency fluctuation, lower liquidity, different accounting methods and economic and political systems, and higher transaction costs. These risks typically are greater in emerging markets. Securities of small‐ and medium‐sized companies tend to have a shorter history of operations, be more volatile and less liquid. Value stocks can perform differently from the market as a whole and other types of stocks.
The material is provided for informational and/or educational purposes only and is not intended to be and should not be construed as investment, legal or tax advice and/or a legal opinion. Investors should consult their financial and tax adviser before making investments. The opinions referenced are as of the date of publication, may be modified due to changes in the market or economic conditions, and may not necessarily come to pass. Information and data presented has been developed internally and/or obtained from sources believed to be reliable. Aristotle Capital does not guarantee the accuracy, adequacy or completeness of such information.
Aristotle Capital Management, LLC is an independent registered investment adviser under the Advisers Act of 1940, as amended. Registration does not imply a certain level of skill or training. More information about Aristotle Capital, including our investment strategies, fees and objectives, can be found in our ADV Part 2, which is available upon request. ACM-2304-20


Composite returns for all periods ended March 31, 2023 are preliminary pending final account reconciliation.
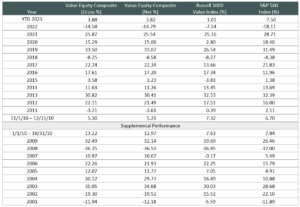
Past performance is not indicative of future results. The information provided should not be considered financial advice or a recommendation to purchase or sell any particular security or product. Performance results for periods greater than one year have been annualized. The Aristotle Value Equity strategy has an inception date of November 1, 2010; however, the strategy initially began at Mr. Gleicher’s predecessor firm in October 1997. A supplemental performance track record from January 1, 2001 through October 31, 2010 is provided above. The returns are based on two separate accounts and performance results are based on custodian data. During this time, Mr. Gleicher had primary responsibility for managing the two accounts. Mr. Gleicher began managing one account in November 2000 and the other December 2000.
Returns are presented gross and net of investment advisory fees and include the reinvestment of all income. Gross returns will be reduced by fees and other expenses that may be incurred in the management of the account. Net returns are presented net of actual investment advisory fees and after the deduction of all trading expenses.
The Russell 1000 Value® Index measures the performance of the large cap value segment of the U.S. equity universe. It includes those Russell 1000 Index companies with lower price-to-book ratios and lower expected growth values. The S&P 500® Index is the Standard & Poor’s Composite Index of 500 stocks and is a widely recognized, unmanaged index of common stock prices. The Russell 1000® Growth Index measures the performance of the large cap growth segment of the U.S. equity universe. It includes those Russell 1000 companies with higher price-to-book ratios and higher forecasted growth values. The Russell 2000® Index measures the performance of the small cap segment of the U.S. equity universe. The Russell 2000 Index is a subset of the Russell 3000® Index representing approximately 10% of the total market capitalization of that index. It includes approximately 2,000 of the smallest securities based on a combination of their market cap and current index membership. The Dow Jones Industrial Average® is a price-weighted measure of 30 U.S. blue-chip companies. The Index covers all industries except transportation and utilities. The NASDAQ Composite Index measures all NASDAQ domestic and international based common type stocks listed on The NASDAQ Stock Market. The NASDAQ Composite includes over 3,000 companies, more than most other stock market indexes. The Bloomberg U.S. Aggregate Bond Index is an unmanaged index of domestic investment grade bonds, including corporate, government and mortgage-backed securities. The WTI Crude Oil Index is a major trading classification of sweet light crude oil that serves as a major benchmark price for oil consumed in the United States. The 3-Month U.S. Treasury Bill is a short-term debt obligation backed by the U.S. Treasury Department with a maturity of three months. Consumer Price Index is a measure of the average change over time in the prices paid by urban consumers for a market basket of consumer goods and services. The volatility (beta) of the Composite may be greater or less than its respective benchmarks. It is not possible to invest directly in these indices.

