Commentary
International Equity 2Q 2024
(All MSCI index returns are shown net and in U.S. dollars unless otherwise noted.)
Markets Review

Sources: CAPS CompositeHubTM, Bloomberg
Past performance is not indicative of future results. Aristotle International Equity Composite returns are presented gross and net of investment advisory fees and include the reinvestment of all income. Gross returns will be reduced by fees and other expenses that may be incurred in the management of the account. Net returns are presented net of actual investment advisory fees and after the deduction of all trading expenses. Aristotle Capital Composite returns are preliminary pending final account reconciliation. Please see important disclosures at the end of this document.
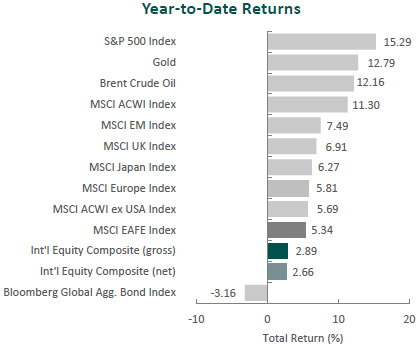
Global equity markets were mixed during the second quarter. Overall, the MSCI ACWI Index rose 2.87% during the period. Concurrently, the Bloomberg Global Aggregate Bond Index fell 1.10%. In terms of style, value stocks underperformed their growth counterparts during the quarter, with the MSCI ACWI Value Index trailing the MSCI ACWI Growth Index by 6.79%.
The MSCI EAFE Index fell 0.42% during the second quarter, while the MSCI ACWI ex USA Index increased 0.96%. Within the MSCI EAFE Index, Asia was the largest detractor, while the U.K. gained the most. On a sector basis, five of the eleven sectors within the MSCI EAFE Index posted negative returns, with Consumer Discretionary, Real Estate and Materials recording the largest losses. Conversely, Health Care, Financials and Energy performed the best.
The global economy remained resilient, with the IMF estimating global growth to remain steady at 3.2% as inflation converges toward targeted levels. The U.K. hit the 2.0% annual inflation target in May, while the eurozone and U.S. were close behind at 2.6% and 3.3%, respectively. Given the improved inflation outlook, the European Central Bank announced its first rate cut in almost five years, lowering its key rate by 25 basis points to 3.75%. However, the U.K. and U.S. left rates unchanged, citing lingering economic uncertainty and the need for greater confidence that lower levels of inflation would be sustainable.
In Asia, after making a historic change in monetary policy in March, Japan kept its benchmark interest rate unchanged at 0.0% to 0.1% and announced an upcoming plan to unwind its $5 trillion balance sheet. However, with the yen hitting a 34-year low in April, Governor Kazuo Ueda did not rule out an additional rate hike in July. Meanwhile, China also kept its benchmark lending rates unchanged, highlighting the PBOC’s limited policy options as the economy struggles to recover.
In geopolitics, tensions remained high, as Hamas rejected the U.S.-led ceasefire proposal and Israel continued attacks in central and southern Gaza. Conflict between Israel and Hezbollah continued, prompting concerns from U.S. Defenese Secretary Lloyd Austin that heightened activity between the two groups could escalate into a regional war. In Ukraine, conditions in northern Kharkiv stabilized after Russia’s offensive in May, aided by additional weapons and permissions provided by Ukraine’s Western allies. However, a new Russian front line in the north and pressure in the east continues to stretch Ukrainian forces, leading to more civilian deaths. Lastly, trade tensions between the U.S. and China flared, as President Biden announced an increase in tarrifs on $18 billion of Chinese imports.
Performance and Attribution Summary
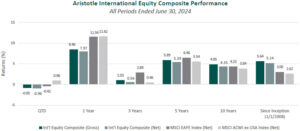
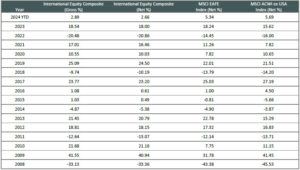
For the second quarter of 2024, Aristotle Capital’s International Equity Composite posted a total return of -0.85% gross of fees (-0.96% net of fees), underperforming the MSCI EAFE Index, which returned -0.42%, and the MSCI ACWI ex USA Index, which returned 0.96%. Please refer to the table below for detailed performance.
| Performance (%) | 2Q24 | YTD | 1 Year | 3 Years | 5 Years | 10 Years | Since Inception* |
|---|---|---|---|---|---|---|---|
| International Equity Composite (gross) | -0.85 | 2.89 | 8.46 | 1.03 | 5.89 | 4.85 | 5.64 |
| International Equity Composite (net) | -0.96 | 2.66 | 7.97 | 0.56 | 5.39 | 4.35 | 5.14 |
| MSCI EAFE Index (net) | -0.42 | 5.34 | 11.54 | 2.89 | 6.46 | 4.33 | 3.00 |
| MSCI ACWI ex USA Index (net) | 0.96 | 5.69 | 11.62 | 0.46 | 5.54 | 3.84 | 2.62 |

Source: FactSet
Past performance is not indicative of future results. Attribution results are based on sector returns which are gross of investment advisory fees. Attribution is based on performance that is gross of investment advisory fees and includes the reinvestment of income.
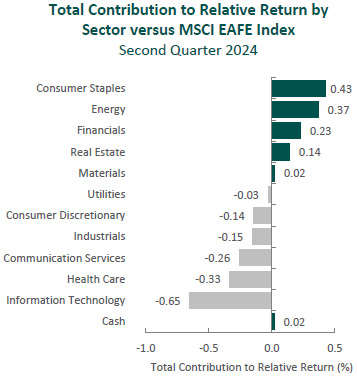
From a sector perspective, the portfolio’s underperformance relative to the MSCI EAFE Index can be attributed to both allocation effects and security selection. Security selection in Information Technology and Communication Services as well as an overweight in Consumer Discretionary detracted the most from the portfolio’s relative performance. Conversely, security selection in Consumer Staples, Energy and Financials contributed to relative return.
Regionally, security selection was responsible for the portfolio’s underperformance, while allocation effects had a positive impact. Security selection in the U.K. detracted the most from relative performance, while an underweight and security selection in Asia contributed.
Contributors and Detractors for 2Q 2024
| Relative Contributors | Relative Detractors |
|---|---|
| Cameco | Accenture |
| DBS Group | Magna International |
| Erste Group Bank | Pan Pacific International |
| Munich Reinsurance | AkzoNobel |
| Alcon | LVMH |
Accenture, the global IT services and consulting firm, was the largest detractor during the quarter. The broader consulting industry has seen a softening of demand as corporate clients have reined in spending amid higher interest rates and macroeconomic uncertainty. While we understand the cyclical nature of the industry, with Accenture’s revenue down just 1% year-over-year, we believe the recent pressure on the company’s share price to be overdone. Bookings have remained strong in the first half of the year, especially for large deals, while generative AI sales surpassed $2 billion for the same period. Accenture’s end-to-end services, functional and geographic scale, industry expertise, and integration within client systems make it uniquely able to perform the large-scale digital transformations its corporate customers’ demand. Moreover, we believe Accenture’s breadth of research and development resources make it well positioned to continue to provide solutions and deepen its partnerships with many of the world’s largest companies as they respond to and seek to implement constantly evolving technologies (including generative AI).
Magna International, a Canada‐based global auto parts, systems and assembly company, was one of the largest detractors for the period. The company lowered its 2024 sales guidance, having seen a slowdown in electric vehicle (EV) adoption across its customer base and expecting a halt in Fisker Ocean production. Despite concerns over automakers delaying EV rollouts, we continue to believe in the longer-term investment catalysts for Magna. These include the company’s ability to enhance margins from operational improvements and leverage its distinctive capabilities to supply parts for an increasingly electrified and autonomous fleet of vehicles. Magna specializes in lightweighting—a necessity for heavy internal combustion engines and electric vehicles—and has made years of investments in self-driving technologies. In addition, with leading market share positions in many of its core markets and products, we believe Magna remains well positioned to benefit as content‐per‐vehicle increases and automotive parts and systems become more complex.
Cameco, one of the world’s largest publicly traded uranium producers, was the top contributor during the period.Support from governments and policymakers for nuclear energy has continued to increase in 2024 as countries realize it can play a crucial role in both promoting energy security and lowering dependence on fossil fuels to meet environmental goals. With higher demand for uranium across the world, Cameco’s production was up more than 25% year-over-year, and its long-term supply contracts have increased (annual commitments now standing at 28 million pounds per year through 2028). We view these fundamental improvements as further proof Cameco is making progress on our catalyst of increasing its uranium volume sold at higher prices, all while lowering production costs through scale and its access to some of the highest-grade ore on the planet. In addition, we believe the company’s continued integration of Westinghouse Electric Company’s market-leading downstream capabilities will allow it to offer a highly competitive nuclear fuel solution. In our opinion, this puts Cameco on track to enjoy higher levels of FREE cash flow and the ability to de-risk its balance sheet as it meets global energy needs.
DBS Group, Singapore’s largest bank1,was a leading contributor. The bank reported strong results, with net interest margins (NIMs) expanding due to the higher-for-longer rate environment and net fee income surpassing $1 billion for the first time. We view these improvements as evidence DBS is executing on previously identified catalysts, including market share gains in wealth management and profitable expansion outside of Singapore. As such, wealth management fees were up ~47% year-over-year as the unit experienced inflows, as well as continued growth in AUM. A large portion of this increase was supported by its 2023 acquisition of Citigroup’s consumer banking business in Taiwan. We continue to admire DBS’s leadership in digital banking and believe it will allow the company to drive further efficiency gains, improve the customer experience, and increase its footprint and penetration both domestically and across Asia.
1As measured by assets as of June 30, 2024.
Recent Portfolio Activity
| Buys | Sells |
|---|---|
| Roche | Novartis |
During the quarter, we sold our position in Novartis and invested the proceeds in Roche.
We have been investors in the Swiss pharmaceutical company Novartis for over a decade, having first purchased shares in 2011. During our holding period, the company has undergone significant changes. Vasant (“Vas”) Narasimhan was promoted to CEO in 2018 and, we believe, has positively influenced the company’s culture and helped shift the business more toward innovative medicines. Examples include the sale of Novartis’s consumer (over-the-counter) joint venture; the divestiture of its vaccines and animal health businesses; the spinoff of Alcon, a global leader in the treatment of eye diseases and eye conditions (also an International Equity holding); and most recently, the spinoff of generics manufacturer Sandoz. As part of its portfolio transformation, Novartis has been able to improve its margins and gain share of branded pharmaceuticals. With many catalysts having neared completion, we decided to sell Novartis to fund the purchase of what we believe is a more optimal investment in Roche.
Roche Holding AG
Founded in 1896 and headquartered in Switzerland, Roche is one of the world’s largest biotechnology and diagnostics companies. The company produced over CHF 58 billion in revenue in 2023, just under half of which was generated in the United States. Roche’s drugs are used to treat conditions in a variety of areas, including oncology (~43% of pharmaceuticals sales), neuroscience (~19%), immunology (~14%), hemophilia (~9%) and others (~15%). The company is also the leading provider of in-vitro diagnostics, with approximately 20% global market share.
Roche’s scale and unique structure, having both a pharmaceutical portfolio (~75% of group revenue) and a diagnostics business (~25%), positions it as a pioneer in personalized healthcare. This evolving field uses diagnostic tests to determine which treatments will work best for patients. Approximately two-thirds of Roche’s R&D projects focus on combining targeted therapies with companion diagnostics.
High-Quality Business
Some of the quality characteristics we have identified for Roche include:
- Long and proven history in the research and development of innovative medicines;
- Economies of scale allow for cost advantages, with more than 29 billion diagnostic tests delivered and millions of patients treated with Roche medicines in 2023;
- Significant expertise in creating molecularly targeted therapies, particularly to fight cancer; and
- Roche’s ability to pair drugs with diagnostics can reduce up-front investments, shorten development timelines and boost the commercial potential of new products.
Attractive Valutaion
We believe increased sales of certain products will lead to higher levels of FREE cash flow than are currently appreciated by the market. Considering Roche’s ~4% dividend yield and our projections of higher future earnings, we view the company to be attractively valued with a normalized P/E of ~14x. We estimate this provides an approximately 30% upside to the share price at time of purchase.
Compelling Catalysts
Catalysts we have identified for Roche, which we believe will cause its stock price to appreciate over our three- to five-year investment horizon, include:
- Continued market share gains within oncology, including for Perjeta to treat breast cancer, Tecentriq for lung cancer, Venclexta for blood cancer and others;
- Increased penetration of Hemlibra for hemophilia and Ocrevus for multiple sclerosis;
- Further recognition of value and incremental use cases for portions of the diagnostics division; and
Potential Future Catalysts: Pipeline of possible blockbuster developments, such as Roche’s Brainshuttle technology used to deliver antibodies to treat neurological diseases, could become catalysts. While the pipeline assets are not (yet) reflected in our estimate of intrinsic value, at present we view these assets as “free options.”
Conclusion
As economic data points fluctuate from quarter to quarter and the macroeconomic outlook remains uncertain, we focus on individual businesses. This quarter we highlighted some of the unique characteristics of Roche which, we believe, afford the company a competitive advantage relative to peers. Rather than attempt to predict central bank policy, GDP, or elections, we will continue to identify and study what we deem to be high-quality companies. It is our core belief that the fundamentals of a business are the most important determinates of its long-term worth.
The opinions expressed herein are those of Aristotle Capital Management, LLC (Aristotle Capital) and are subject to change without notice. Past performance is not a guarantee or indicator of future results. This material is not financial advice or an offer to buy or sell any product. You should not assume that any of the securities transactions, sectors or holdings discussed in this report were or will be profitable, or that recommendations Aristotle Capital makes in the future will be profitable or equal the performance of the securities listed in this report. The portfolio characteristics shown relate to the Aristotle International Equity strategy. Not every client’s account will have these characteristics. Aristotle Capital reserves the right to modify its current investment strategies and techniques based on changing market dynamics or client needs. There is no assurance that any securities discussed herein will remain in an account’s portfolio at the time you receive this report or that securities sold have not been repurchased. The securities discussed may not represent an account’s entire portfolio and, in the aggregate, may represent only a small percentage of an account’s portfolio holdings. The performance attribution presented is of a representative account from Aristotle Capital’s International Equity Composite. The representative account is a discretionary client account which was chosen to most closely reflect the investment style of the strategy. The criteria used for representative account selection is based on the account’s period of time under management and its similarity of holdings in relation to the strategy. Recommendations made in the last 12 months are available upon request.
Returns are presented gross and net of investment advisory fees and include the reinvestment of all income. Gross returns will be reduced by fees and other expenses that may be incurred in the management of the account. Net returns are presented net of actual investment advisory fees and after the deduction of all trading expenses.
All investments carry a certain degree of risk, including the possible loss of principal. Investments are also subject to political, market, currency and regulatory risks or economic developments. International investments involve special risks that may in particular cause a loss in principal, including currency fluctuation, lower liquidity, different accounting methods and economic and political systems, and higher transaction costs. These risks typically are greater in emerging markets. Securities of small‐ and medium‐sized companies tend to have a shorter history of operations, be more volatile and less liquid. Value stocks can perform differently from the market as a whole and other types of stocks.
The material is provided for informational and/or educational purposes only and is not intended to be and should not be construed as investment, legal or tax advice and/or a legal opinion. Investors should consult their financial and tax adviser before making investments. The opinions referenced are as of the date of publication, may be modified due to changes in the market or economic conditions, and may not necessarily come to pass. Information and data presented has been developed internally and/or obtained from sources believed to be reliable. Aristotle Capital does not guarantee the accuracy, adequacy or completeness of such information.
Aristotle Capital Management, LLC is an independent registered investment adviser under the Advisers Act of 1940, as amended. Registration does not imply a certain level of skill or training. More information about Aristotle Capital, including our investment strategies, fees and objectives, can be found in our Form ADV Part 2, which is available upon request. ACM-2407-32

Sources: CAPS CompositeHubTM, MSCI

Composite returns for all periods ended June 30, 2024 are preliminary pending final account reconciliation.
Past performance is not indicative of future results. The information provided should not be considered financial advice or a recommendation to purchase or sell any particular security or product. Performance results for periods greater than one year have been annualized.
Returns are presented gross and net of investment advisory fees and include the reinvestment of all income. Gross returns will be reduced by fees and other expenses that may be incurred in the management of the account. Net returns are presented net of actual investment advisory fees and after the deduction of all trading expenses.
The MSCI EAFE Index (Europe, Australasia, Far East) is a free float-adjusted market capitalization-weighted index that is designed to measure the equity market performance of developed markets, excluding the United States and Canada. The MSCI EAFE Index consists of the following 21 developed market country indexes: Australia, Austria, Belgium, Denmark, Finland, France, Germany, Hong Kong, Ireland, Israel, Italy, Japan, the Netherlands, New Zealand, Norway, Portugal, Singapore, Spain, Sweden, Switzerland and the United Kingdom. The MSCI ACWI captures large and mid-cap representation across 23 developed market countries and 24 emerging markets countries. With approximately 2,800 constituents, the Index covers approximately 85% of the global investable equity opportunity set. The MSCI ACWI Growth Index captures large and mid-cap securities exhibiting overall growth style characteristics across 23 developed markets countries and 24 emerging markets countries. The MSCI ACWI Value Index captures large and mid-cap securities exhibiting overall value style characteristics across 23 developed markets countries and 24 emerging markets countries. The MSCI ACWI ex USA Index captures large and mid-cap representation across 22 of 23 developed markets countries (excluding the United States) and 24 emerging markets countries. With approximately 2,200 constituents, the Index covers approximately 85% of the global equity opportunity set outside the United States. The MSCI Emerging Markets Index is a free float-adjusted market capitalization-weighted index that is designed to measure the equity market performance of emerging markets. The MSCI Emerging Markets Index consists of the following 24 emerging market country indexes: Brazil, Chile, China, Colombia, Czech Republic, Egypt, Greece, Hungary, India, Indonesia, Korea, Kuwait, Malaysia, Mexico, Peru, Philippines, Poland, Qatar, Saudi Arabia, South Africa, Taiwan, Thailand, Turkey and United Arab Emirates. The S&P 500® Index is the Standard & Poor’s Composite Index of 500 stocks and is a widely recognized, unmanaged index of common stock prices. The Brent Crude Oil Index is a major trading classification of sweet light crude oil that serves as a major benchmark price for purchases of oil worldwide. The MSCI Japan Index is designed to measure the performance of the large and mid-cap segments of the Japanese market. With approximately 200 constituents, the Index covers approximately 85% of the free float-adjusted market capitalization in Japan. The Bloomberg Global Aggregate Bond Index is a flagship measure of global investment grade debt from 28 local currency markets. This multi-currency benchmark includes treasury, government-related, corporate and securitized fixed-rate bonds from both developed and emerging markets issuers. The MSCI United Kingdom Index is designed to measure the performance of the large and mid-cap segments of the U.K. market. With nearly 100 constituents, the Index covers approximately 85% of the free float-adjusted market capitalization in the United Kingdom. The MSCI Europe Index captures large and mid-cap representation across 15 developed markets countries in Europe. With approximately 400 constituents, the Index covers approximately 85% of the free float-adjusted market capitalization across the European developed markets equity universe. These indexes have been selected as the benchmarks and are used for comparison purposes only. The volatility (beta) of the Composite may be greater or less than the respective benchmarks. It is not possible to invest directly in these indexes.


