Commentary
Global Equity 2Q 2024
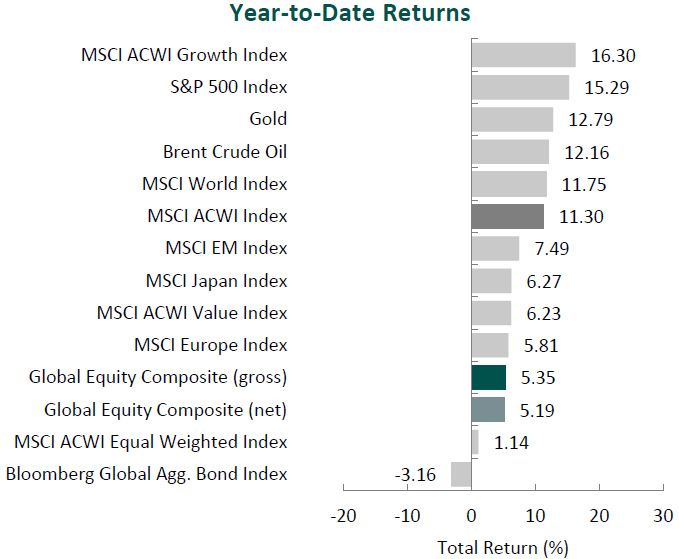
(All MSCI index returns are shown net and in U.S. dollars unless otherwise noted.)
Markets Review

Sources: CAPS CompositeHubTM, Bloomberg
Past performance is not indicative of future results. Aristotle Global Equity Composite returns are presented gross and net of investment advisory fees and include the reinvestment of all income. Gross returns will be reduced by fees and other expenses that may be incurred in the management of the account. Net returns are presented net of actual investment advisory fees and after the deduction of all trading expenses. Aristotle Capital Composite returns are preliminary pending final account reconciliation. Please see important disclosures at the end of this document.
Global equity markets were mixed during the second quarter. Overall, the MSCI ACWI Index rose 2.87% during the period. Concurrently, the Bloomberg Global Aggregate Bond Index fell 1.10%. In terms of style, value stocks underperformed their growth counterparts during the quarter, with the MSCI ACWI Value Index trailing the MSCI ACWI Growth Index by 6.79%.
Emerging Markets and North America were the strongest regions, while Japan posted a negative return. On a sector basis, five out of the eleven sectors within the MSCI ACWI Index finished in the green, with Information Technology, Communication Services and Utilities increasing the most. Meanwhile, Materials, Real Estate and Industrials were the weakest performers.
The global economy remained resilient, with the IMF estimating global growth to remain steady at 3.2% as inflation converges toward targeted levels. The U.K. hit the 2.0% annual inflation target in May, while the eurozone and U.S. were close behind at 2.6% and 3.3%, respectively. Given the improved inflation outlook, the European Central Bank announced its first rate cut in almost five years, lowering its key rate by 25 basis points to 3.75%. However, the U.K. and U.S. left rates unchanged, citing lingering economic uncertainty and the need for greater confidence that lower levels of inflation would be sustainable.
In Asia, after making a historic change in monetary policy in March, Japan kept its benchmark interest rate unchanged at 0.0% to 0.1% and announced an upcoming plan to unwind its $5 trillion balance sheet. However, with the yen hitting a 34-year low in April, Governor Kazuo Ueda did not rule out an additional rate hike in July. Meanwhile, China also kept its benchmark lending rates unchanged, highlighting the PBOC’s limited policy options as the economy struggles to recover.
In geopolitics, tensions remained high, as Hamas rejected the U.S.-led ceasefire proposal and Israel continued attacks in central and southern Gaza. Conflict between Israel and Hezbollah continued, prompting concerns from U.S. Defenese Secretary Lloyd Austin that heightened activity between the two groups could escalate into a regional war. In Ukraine, conditions in northern Kharkiv stabilized after Russia’s offensive in May, aided by additional weapons and permissions provided by Ukraine’s Western allies. However, a new Russian front line in the north and pressure in the east continues to stretch Ukrainian forces, leading to more civilian deaths. Lastly, trade tensions between the U.S. and China flared, as President Biden announced an increase in tarrifs on $18 billion of Chinese imports.
Performance and Attribution Summary
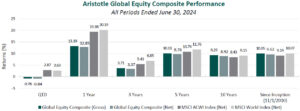
For the second quarter of 2024, Aristotle Capital’s Global Equity Composite posted a total return of -0.76% gross of fees (-0.84% net of fees), underperforming the MSCI ACWI Index, which returned 2.87%, and the MSCI World Index, which returned 2.63%. Please refer to the table below for detailed performance.
| Performance (%) | 2Q24 | YTD | 1 Year | 3 Years | 5 Years | 10 Years | Since Inception* |
|---|---|---|---|---|---|---|---|
| Global Equity Composite (gross) | -0.76 | 5.35 | 13.19 | 3.71 | 10.11 | 9.29 | 10.05 |
| Global Equity Composite (net) | -0.84 | 5.19 | 12.85 | 3.37 | 9.76 | 8.92 | 9.62 |
| MSCI ACWI Index (net) | 2.87 | 11.30 | 19.38 | 5.43 | 10.74 | 8.43 | 9.14 |
| MSCI World Index (net) | 2.63 | 11.75 | 20.19 | 6.85 | 11.76 | 9.15 | 10.07 |

Source: FactSet
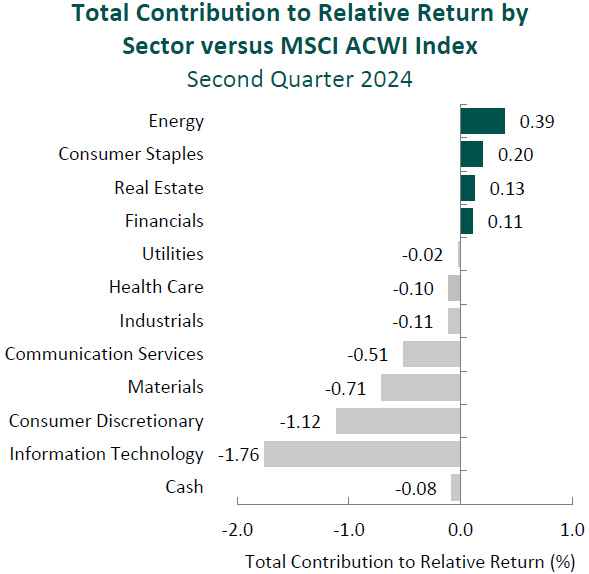
Past performance is not indicative of future results. Attribution results are based on sector returns which are gross of investment advisory fees. Attribution is based on performance that is gross of investment advisory fees and includes the reinvestment of income.
From a sector perspective, the portfolio’s underperformance relative to the MSCI ACWI Index can be attributed to both security selection and allocation effects. Security selection in Information Technology, Consumer Discretionary and Materials detracted the most from the portfolio’s relative performance. Conversely, security selection in Energy and Consumer Staples and a lack of exposure to Real Estate contributed to relative return.
Regionally, both security selection and allocation effects were responsible for the portfolio’s underperformance relative to the MSCI ACWI Index. Security selection in North America and an overweight in Japan detracted the most from relative performance, while security selection in Japan and Asia/Pacific ex-Japan contributed.
Contributors and Detractors for 2Q 2024
| Relative Contributors | Relative Detractors |
|---|---|
| Cameco | Lennar |
| Qualcomm | FirstCash |
| Adobe | Martin Marietta Materials |
| DBS Group | Oshkosh |
| Amgen | LVMH |
Lennar, one of the nation’s largest homebuilders, was the biggest detractor for the quarter. Despite executing on previously identified catalysts, including shifting toward a capital-light business model (i.e., 79% of land controlled via options versus 21% owned, an improvement from 70/30 just one year ago), formal plans for a spinoff of $6 billion to $8 billion of land assets, and monetizing non-core assets such as the recently announced sale of multifamily housing assets, Lennar’s share price declined during the quarter. Management has called out affordability pressures (e.g., higher prices and mortgage rates) as challenges that have pressured gross margins and may continue to do so. Lennar has navigated affordability issues through more efficient operations (i.e., leveraging scale, as well as accelerating and matching production and sales volumes to lower construction costs) and increased incentives, the latter of which we view as unsustainable. As always, we are closely monitoring these cyclical dynamics with an eye to what is truly “normal.” Moreover, we take (some) comfort in Lennar’s excess net cash position and its potential to redeploy capital in the business and/or return cash to shareholders. Lastly, we remain sanguine on the U.S housing market, as well as Lennar’s ability to manage through the inevitable housing cycles.
Oshkosh, a manufacturer of purpose-built vehicles worldwide, was a main detractor during the quarter. Despite a decline in share price, the company has seen fundamental improvements and strong demand for its vehicles, including an increasing backlog of orders for fire trucks. As such, revenue for Oshkosh’s Vocational segment was up over 35% year-over-year. We believe this segment should be able to expand its margins, particularly as the company was awarded a contract to produce the “Next Generation Delivery Vehicle” for the U.S. Postal Service, which should begin to ramp up at the beginning of next year. This contract could generate in excess of $6 billion in revenue for the company. Furthermore, we continue to believe that Oshkosh is a high-quality business that should be able to create innovative equipment and gain market share across segments. This includes its aerial work platforms as global safety standards increase around the world.
Cameco, one of the world’s largest publicly traded uranium producers, was the top contributor during the period. Support from governments and policymakers for nuclear energy has continued to increase in 2024 as countries realize it can play a crucial role in both promoting energy security and lowering dependence on fossil fuels to meet environmental goals. With higher demand for uranium across the world, Cameco’s production was up more than 25% year-over-year, and its long-term supply contracts have increased (annual commitments now standing at 28 million pounds per year through 2028). We view these fundamental improvements as further proof Cameco is making progress on our catalyst of increasing its uranium volume sold at higher prices, all while lowering production costs through scale and its access to some of the highest-grade ore on the planet. In addition, we believe the company’s continued integration of Westinghouse Electric Company’s market-leading downstream capabilities will allow it to offer a highly competitive nuclear fuel solution. In our opinion, this puts Cameco on track to enjoy higher levels of FREE cash flow and the ability to de-risk its balance sheet as it meets global energy needs.
Qualcomm, a leading wireless communications technology company, was a leading contributor for the quarter.After a period of weaker global demand for smartphones (driven by a slowdown in China) and elevated channel inventory, demand from Chinese handset manufacturers accelerated 40% year-over-year. More importantly, in our opinion, Qualcomm continues to execute on a previously identified catalyst of shifting its business mix beyond smartphones. The company announced increased progress for its automotive and Internet of Things (IoT) solutions. Within auto, the increase in vehicle content has resulted in 35% year-over-year revenue growth, with a design win pipeline of ~$45 billion, keeping the company on track to achieving ~$4 billion in auto-related revenues by 2026. In recent years, despite persistent threats of insourcing from large clients (most notably Apple), Qualcomm has been able to retain its high market share in handsets while simultaneously expanding in non-smartphone devices. We believe this progress is a testament to Qualcomm’s history of high (and productive) R&D spending, resulting in technological superiority. We believe Qualcomm’s technologies will continue to benefit as the world stays on a path toward a proliferation of connectivity between varying devices and as AI applications extend from the cloud to on-device.
Recent Portfolio Activity
| Buys | Sells |
|---|---|
| None | KDDI |
| Veralto |
During the quarter, we sold our positions in KDDI and Veralto.
We first invested in KDDI, the Japanese telecom company, in the third quarter of 2013. We have long been attracted to the unique structure of Japan’s telecom industry since the spectrum is “owned by the people.” KDDI therefore benefits from lower capital intensity and higher FREE cash flow when compared to U.S. peers that are required to participate in expensive spectrum auctions. During our ownership, the company has taken advantage of what we once viewed as abnormally low penetration of smartphones in Japan (increasing from ~40% in 2013 to ~85% today). This shift, combined with the oligopolistic competitive environment in which government-controlled NTT has ceded market share, paved the way for a favorable decade for KDDI, allowing it to increase average revenue per user (“ARPU”) and offer additional ancillary services. Though we continue to view shares of the company as inexpensive, we decided to exit our investment for Global Equity clients, as we believe several of our catalysts have neared completion.
In the fourth quarter of 2023, we received shares of the water and product quality company Veralto when Danaher, a current Global Equity holding, spun off the business. After further assessing the now independently operated Veralto, we decided to exit our position.
Conclusion
As economic data points fluctuate from quarter to quarter and the macroeconomic outlook remains uncertain, we focus on individual businesses. By identifying high-quality businesses that are undervalued with actionable catalysts on the horizon, we aim to withstand short-term volatility associated with the ever-changing macroeconomic landscape. It is our core belief that the fundamentals of a business are the most important determinates of its long-term worth.
The opinions expressed herein are those of Aristotle Capital Management, LLC (Aristotle Capital) and are subject to change without notice. Past performance is not a guarantee or indicator of future results. This material is not financial advice or an offer to buy or sell any product. You should not assume that any of the securities transactions, sectors or holdings discussed in this report were or will be profitable, or that recommendations Aristotle Capital makes in the future will be profitable or equal the performance of the securities listed in this report. The portfolio characteristics shown relate to the Aristotle Global Equity strategy. Not every client’s account will have these characteristics. Aristotle Capital reserves the right to modify its current investment strategies and techniques based on changing market dynamics or client needs. There is no assurance that any securities discussed herein will remain in an account’s portfolio at the time you receive this report or that securities sold have not been repurchased. The securities discussed may not represent an account’s entire portfolio and, in the aggregate, may represent only a small percentage of an account’s portfolio holdings. The performance attribution presented is of a representative account from Aristotle Capital’s Global Equity Composite. The representative account is a discretionary client account which was chosen to most closely reflect the investment style of the strategy. The criteria used for representative account selection is based on the account’s period of time under management and its similarity of holdings in relation to the strategy. Recommendations made in the last 12 months are available upon request.
Returns are presented gross and net of investment advisory fees and include the reinvestment of all income. Gross returns will be reduced by fees and other expenses that may be incurred in the management of the account. Net returns are presented net of actual investment advisory fees and after the deduction of all trading expenses.
All investments carry a certain degree of risk, including the possible loss of principal. Investments are also subject to political, market, currency and regulatory risks or economic developments. International investments involve special risks that may in particular cause a loss in principal, including currency fluctuation, lower liquidity, different accounting methods and economic and political systems, and higher transaction costs. These risks typically are greater in emerging markets. Securities of small‐ and medium‐sized companies tend to have a shorter history of operations, be more volatile and less liquid. Value stocks can perform differently from the market as a whole and other types of stocks.
The material is provided for informational and/or educational purposes only and is not intended to be and should not be construed as investment, legal or tax advice and/or a legal opinion. Investors should consult their financial and tax adviser before making investments. The opinions referenced are as of the date of publication, may be modified due to changes in the market or economic conditions, and may not necessarily come to pass. Information and data presented has been developed internally and/or obtained from sources believed to be reliable. Aristotle Capital does not guarantee the accuracy, adequacy or completeness of such information.
Aristotle Capital Management, LLC is an independent investment adviser registered under the Investment Advisers Act of 1940, as amended. Registration does not imply a certain level of skill or training. More information about Aristotle Capital, including our investment strategies, fees and objectives, can be found in our Form ADV Part 2, which is available upon request. ACM-2407-62

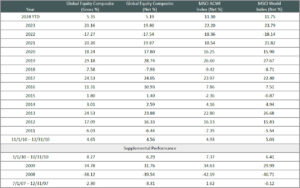
Sources: CAPS CompositeHubTM, MSCI

Composite returns for all periods ended June 30, 2024 are preliminary pending final account reconciliation. MSCI ACWI (Net) was stated as the primary benchmark on June 1, 2024 and MSCI World (Net) became the secondary benchmark.
The Aristotle Global Equity Composite has an inception date of November 1, 2010; however, the strategy initially began at Howard Gleicher’s predecessor firm in July 2007. A supplemental performance track record from January 1, 2008 through October 31, 2010 is provided on this page and complements the Global Equity Composite presentation that is located at the end of this presentation. The performance results were achieved while Mr. Gleicher managed the strategy at a prior firm. The returns are those of a publicly available mutual fund from the fund’s inception through Mr. Gleicher’s departure from the firm. During that time, Mr. Gleicher had primary responsibility for managing the fund.
Past performance is not indicative of future results. The information provided should not be considered financial advice or a recommendation to purchase or sell any particular security or product. Performance results for periods greater than one year have been annualized.
Returns are presented gross and net of investment advisory fees and include the reinvestment of all income. Gross returns will be reduced by fees and other expenses that may be incurred in the management of the account. Net returns are presented net of actual investment advisory fees and after the deduction of all trading expenses.
MSCI ACWI (Net) was stated as the primary benchmark on June 1, 2024 and MSCI World (Net) became the secondary benchmark. The MSCI ACWI captures large and mid-cap representation across 23 developed markets and 24 emerging markets countries. With approximately 2,800 constituents, the Index covers approximately 85% of the global investable equity opportunity set. The MSCI ACWI Equal Weighted Index represents an alternative weighting scheme to its market cap weighted parent index, MSCI ACWI. The index includes the same constituents as its parent (large and mid cap securities from 23 Developed Markets (DM) and 24 Emerging Markets (EM) countries*). However, at each quarterly rebalance date, all index constituents are weighted equally, effectively removing the influence of each constituent’s current price (high or low). Between rebalances, index constituent weightings will fluctuate due to price performance. The MSCI World Index is a free float-adjusted market capitalization weighted index that is designed to measure the equity market performance of developed markets. The MSCI World Index consists of the following 23 developed market country indexes: Australia, Austria, Belgium, Canada, Denmark, Finland, France, Germany, Hong Kong, Ireland, Israel, Italy, Japan, Netherlands, New Zealand, Norway, Portugal, Singapore, Spain, Sweden, Switzerland, the United Kingdom and the United States. The MSCI Emerging Markets Index is a free float-adjusted market capitalization-weighted index that is designed to measure equity market performance of emerging markets. The MSCI Emerging Markets Index consists of the following 24 emerging market country indexes: Brazil, Chile, China, Colombia, Czech Republic, Egypt, Greece, Hungary, India, Indonesia, Korea, Kuwait, Malaysia, Mexico, Peru, Philippines, Poland, Qatar, Saudi Arabia, South Africa, Taiwan, Thailand, Turkey and United Arab Emirates. The MSCI ACWI Growth Index captures large and mid-cap securities exhibiting overall growth style characteristics across 23 developed markets countries and 24 emerging markets countries. The MSCI ACWI Value Index captures large and mid-cap securities exhibiting overall value style characteristics across 23 developed markets countries and 24 emerging markets countries. The MSCI Europe Index captures large and mid-cap representation across 15 developed markets countries in Europe. With more than 400 constituents, the Index covers approximately 85% of the free float-adjusted market capitalization across the European developed markets equity universe. The MSCI Japan Index is designed to measure the performance of the large and mid-cap segments of the Japanese market. With approximately 200 constituents, the Index covers approximately 85% of the free float-adjusted market capitalization in Japan. The S&P 500® Index is the Standard & Poor’s Composite Index of 500 stocks and is a widely recognized, unmanaged index of common stock prices. The Bloomberg Global Aggregate Bond Index is a flagship measure of global investment grade debt from 28 local currency markets. This multi-currency benchmark includes Treasury, government-related, corporate and securitized fixed rate bonds from both developed and emerging markets issuers. The Brent Crude Oil Index is a major trading classification of sweet light crude oil that serves as a major benchmark price for purchases of oil worldwide. The volatility (beta) of the Composite may be greater or less than the benchmarks. It is not possible to invest directly in these indexes.


