Commentary
Focus Growth 2Q 2023
Markets Review
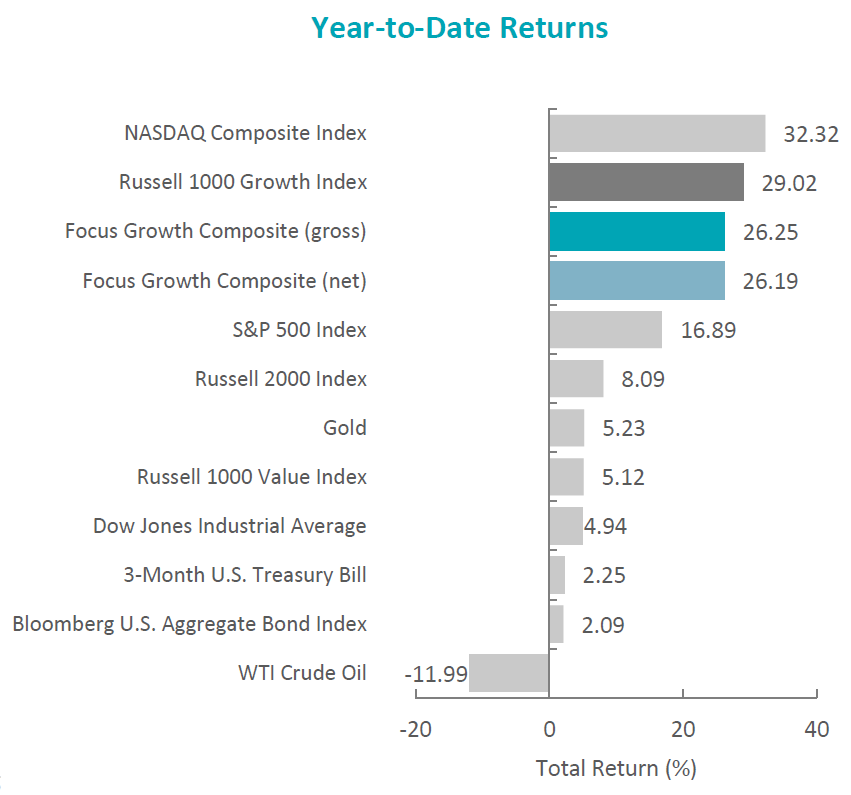
The U.S. equity market continued its rebound, as the S&P 500 Index rose 8.74% during the quarter. However, the market rally has been remarkably concentrated, with just 25% of stocks outperforming the S&P 500 in the first 6-months of 2023. This makes it the narrowest market breadth in history for the first half of a year.1 Concurrently, the Bloomberg U.S. Aggregate Bond Index slightly declined, returning -0.84% for the quarter. In terms of style, the Russell 1000 Growth Index outperformed its value counterpart by 8.74%.
Sources: SS&C Advent, Bloomberg
Past performance is not indicative of future results. Aristotle Atlantic Focus Growth Composite returns are presented gross and net of investment advisory fees and include the reinvestment of all income. Gross returns will be reduced by fees and other expenses that may be incurred in the management of the account. Net returns are presented net of actual investment advisory fees and after the deduction of all trading expenses. Aristotle Atlantic Composite returns are preliminary pending final account reconciliation. Please see important disclosures at the end of this document.
Nine out of the eleven sectors within the Russell 1000 Growth Index finished higher for the quarter, with Information Technology, Communication Services and Consumer Discretionary gaining the most. Meanwhile, Energy, Real Estate and Consumer Staples were the worst-performing sectors.
Despite the positive trajectory of the market, economic data points were mixed. After expanding by 2.6% year-over-year in the fourth quarter of last year, growth in the U.S. slowed in the first quarter to 2.0% as private inventory investment and residential fixed investment declined. Nevertheless, personal consumption expenditures remained strong, increasing by 4.2% from last year. Meanwhile, inflation remained above its historical average of 3.8%, but the CPI continued to decline, as the figure fell from 4.9% to 4.0% for the 12-month periods ending in April and May, respectively. The moderation in prices was driven by a decline in the major energy component indexes. Lastly, the labor market remained tight, with unemployment at 3.7% in May.
In addition to economic data, lingering stress at regional banks, as well as political risk, came into focus during the period. Although significant efforts were previously made to provide stability to the U.S. banking system, the collapse of First Republic Bank, the largest banking failure since 2008, reignited concerns. However, the government quickly seized the bank and sold it to JPMorgan Chase, reassuring depositors. The government’s action, combined with minimal increases in default rates, resilient asset performance and loan growth, and stable deposits at other regional banks, eased fears surrounding the industry. Subsequently, attention turned to the approaching deadline to raise the federal debt ceiling. Concerns of a potential U.S. default mounted as the political parties refused to budge on concessions for a deal. After weeks of negotiations, an agreement was eventually reached to suspend the federal debt ceiling for two years while limiting the growth of federal discretionary spending during that same time span.
With the volatile and uncertain macroeconomic backdrop and continued pattern of disinflation, the Federal Reserve (Fed) held rates steady in June, marking the first pause after a ten-meeting hiking campaign that brought the benchmark rate to a range of 5.00% to 5.25%. The Federal Reserve Open Market Committee emphasized the need to account for the cumulative tightening of monetary policy and the lagging effects of monetary policy decisions, as well as other economic and financial developments, in order to determine whether additional policy firming would be needed to achieve the 2% goal for inflation.
On the corporate earnings front, S&P 500 companies reported a decline in earnings of 2.2%, the second straight quarter of a year-over-year decrease. However, results were better than initial expectations of a 6.7%2 decline, as companies referenced successful cost cutting, improved operational efficiency and waning inflationary pressures. Overall, 78% of S&P 500 companies exceeded EPS estimates (above the five-year average of 77%), and the number of companies mentioning inflation on earnings calls declined by over 12%.
Performance and Attribution Summary
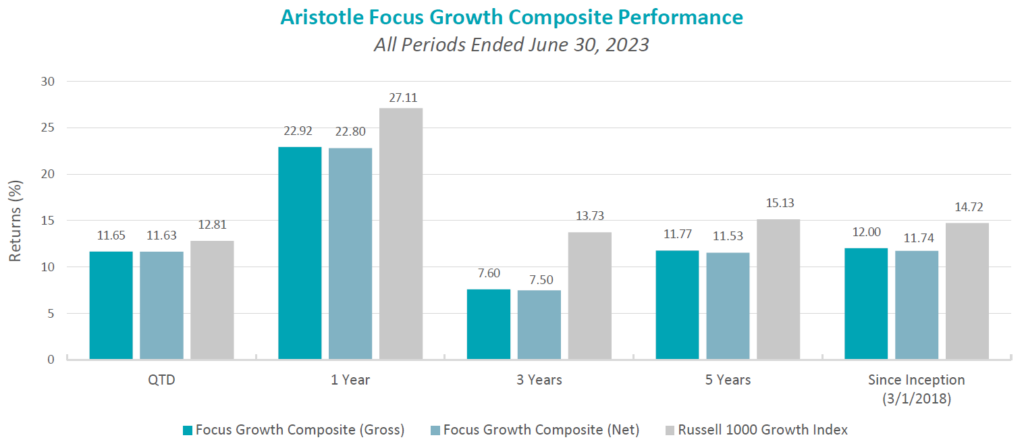
For the second quarter of 2023, Aristotle Atlantic’s Focus Growth Composite posted a total return of 11.65% gross of fees (11.63% net of fees), underperforming the 12.81% total return of the Russell 1000 Growth Index.
| Performance (%) | 2Q23 | 1 Year | 3 Years | 5 Years | Since Inception* |
|---|---|---|---|---|---|
| Focus Growth Composite (gross) | 11.65 | 22.92 | 7.60 | 11.77 | 12.00 |
| Focus Growth Composite (net) | 11.63 | 22.80 | 7.50 | 11.53 | 11.74 |
| Russell 1000 Growth Index | 12.81 | 27.11 | 13.73 | 15.13 | 14.72 |
Sources: FactSet
Past performance is not indicative of future results. Attribution results are based on sector returns which are gross of investment advisory fees. Attribution is based on performance that is gross of investment advisory fees and includes the reinvestment of income. Please see important disclosures at the end of this document.
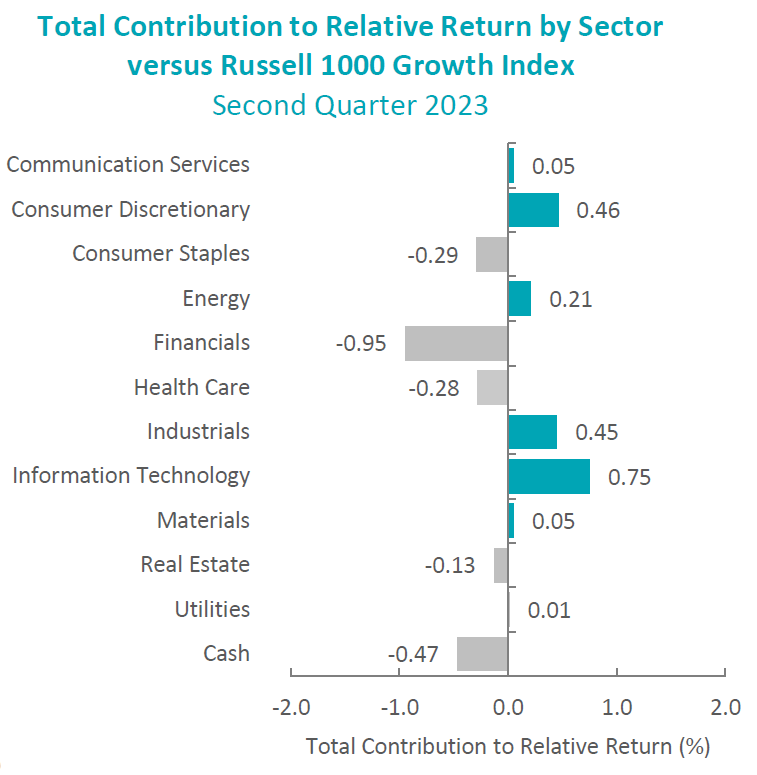
During the second quarter, the portfolio’s underperformance relative to the Russell 1000 Growth Index was due to allocation effects, while security selection contributed. Security selection in Financials, as well as overweights in Consumer Staples and Health Care, detracted the most from performance. Conversely, security selection in Information Technology and Consumer Discretionary, as well as an underweight in Industrials, contributed to relative results.
Contributors and Detractors for 2Q 2023
| Relative Contributors | Relative Detractors |
|---|---|
| Nvidia | MSCI |
| Guardant Health | Dollar General |
| ServiceNow | Adaptive Biotechnologies |
| Amazon | Prologis |
| KLA | Visa |
Contributors
Nvidia
Nvidia contributed to outperformance, as the company benefits from increased demand for its Graphic Processing Unit (GPU) semiconductor systems used in accelerated computing that is used to power Artificial Intelligence (AI) and Large Language Models (LLM). The company reported strong first fiscal quarter 2024 results and issued guidance for the second quarter and fiscal year 2024 that was ahead of consensus due to continuing strong demand trends for its data center GPU systems.
Guardant Health
Guardant shares ended the quarter strong, recovering to some extent from the previous weakness in the quarter, as the company reported accelerating clinical volume growth and raised earnings guidance. In addition, the company announced additional U.S. commercial insurance coverage for their Guardant 360 test in the U.S. and government reimbursement in Japan. Lasty, the company completed a successful secondary offering, raising approximately $250 million.
Detractors
Prologis
Prologis underperformed in the second quarter along with the real estate sector, as the appetite for risk in the broad market increased. Prologis’ results have shown less cyclicality during the recent downturn in the sector, so there is less scope for an earnings recovery as is the case in more beaten-down real estate companies. The company announced the acquisition of a 14 million square foot portfolio of industrial properties from Blackstone for $3.1 billion at the end of the second quarter.
Adaptive Biotechnologies
Adaptive Biotechnology shares ended the quarter lower despite the company reporting a small revenue beat and accelerating clinical volumes. Clinical volumes rose 54% year-over-year in the quarter and grew 15% sequentially. The company is well-funded, and momentum is building in their minimal residual testing business. Additionally, the company’s drug development partner, Genetech, reported Food and Drug Administration’s (FDA) acceptance of an investigational new drug application on the collaboration’s first T-cell receptor-based therapy. The weakness during the quarter was most likely attributable to increasing interest rates and the negative implication of higher rates for emerging growth companies.
Recent Portfolio Activity
The table below shows all buys and sells completed during the quarter, followed by a brief rationale.
| Buys | Sells |
|---|---|
| Netflix | Dollar General |
| S&P Global | MSCI |
Buys
Netflix
Netflix is one of the leaders in streaming entertainment services that offers a broad selection of movies, TV series, documentaries and original content across numerous genres to its 223 million paid subscribers in over 190 countries. The company was initially founded as a DVD-by-mail service but has evolved into the world’s largest streaming-only platform and became one of the largest producers of original video content globally. Netflix offers a variety of subscription-only and ad-supported memberships, and its focus on original content and investment in technology to improve the user experience have enabled it to maintain a significant competitive advantage over streaming peers.
We initiated a position in Netflix and see new initiatives and further international expansion which can reaccelerate subscriber additions. The company recently introduced an advertising-supported membership plan that should enable it to augment revenue growth by tapping into the growing market for digital advertising while not cannibalizing its existing subscription-only plans. In addition, the company has recently implemented password-sharing restrictions, suggesting that the conversion of former password sharers to paying subscribers is tracking much better than expected. Netflix has led the transition from traditional linear TV to streaming and remains the dominant platform globally.
S&P Global
S&P Global provides financial information and analytics, including credit ratings, financial market benchmarks and workflow solutions. Originally McGraw-Hill Financial, the company changed its name in 2016. The company’s operations consist of five segments: ratings, commodity insights, indices, market intelligence and mobility.
We see S&P Global’s diversified business model as primarily subscription-based, which generates a sizeable recurring revenue stream and helps it navigate various market or macroeconomic environments. The company has a significant competitive advantage that provides substantial barriers to entry and sustainable competitive supremacy. We believe that technology-focused strategic investments made over the past few years should help accelerate organic growth over the next few years, as the company continuously seeks to improve its existing offerings while striving to meet ever-evolving client needs.
Sells
Dollar General
We sold our position in Dollar General, following a weaker-than-expected quarterly earnings report and a lowered earnings outlook. The company’s core consumer, while still employed, continues to be impacted by higher inflation. Additionally, we saw the negative impacts of lower-than-expected tax refunds and reductions in the Federal Supplemental Nutrition Assistance Program (SNAP). Dollar General remained committed to spending on customer experience and investing in price to help their customers through the tougher economic environment, as a result, reducing the earnings guidance by a greater amount than the sales reductions.
MSCI
We sold our position in MSCI, as its fast-growing ESG and Climate segment experienced a significant revenue growth deceleration in the most recently completed quarter, primarily driven by regulatory uncertainty in Europe and increasing anti-ESG sentiment in the U.S. However, the company remains well-positioned in the global ESG and Climate market long-term, but we feel S&P Global offers a more compelling opportunity currently.
Outlook
The equity markets in the second quarter were helped by a resilient economy that has been able to absorb an aggressive tightening cycle. There are segments of the economy, such as housing, that have bottomed out and started a recovery phase. This may complicate the Fed’s task of bringing down inflation and necessitate further rate hikes. One area that continues to garner attention is the commercial office real estate market. Cash flows on many commercial real estate properties will be challenged due to occupancy rates well below historical levels and the re-financing of debt at much higher levels. This may put a spotlight back on regional banks where many of these loans are held. On a positive note, AI has entered a new phase of significant investment. This has resulted in a build-up of computing power at many of the large technology companies. The result has been an equity market posting positive returns year-to-date but in a very narrow area of AI beneficiaries. A broadening out-of-equity market returns will depend on averting a recession. On the geopolitical front, the war in Ukraine has become more unstable with the recent turmoil within the Russian military. With many challenges to the economy, there are opportunities, as consumers have shifted to spending on services and the government enacted laws to get funding into areas, such as infrastructure, semiconductors and clean energy. Our focus remains at the company level, with an emphasis on seeking to invest in companies with secular tailwinds or strong product-driven cycles.
1 Source: Bank of America
2 Source: FactSet earnings insight
The opinions expressed herein are those of Aristotle Atlantic Partners, LLC (Aristotle Atlantic) and are subject to change without notice. Past performance is not a guarantee or indicator of future results. This material is not financial advice or an offer to purchase or sell any product. You should not assume that any of the securities transactions, sectors or holdings discussed in this report were or will be profitable, or that recommendations Aristotle Atlantic makes in the future will be profitable or equal the performance of the listed in this report. The portfolio characteristics shown relate to the Aristotle Atlantic Focus Growth strategy. Not every client’s account will have these characteristics. Aristotle Atlantic reserves the right to modify its current investment strategies and techniques based on changing market dynamics or client needs. There is no assurance that any securities discussed herein will remain in an account’s portfolio at the time you receive this report or that securities sold have not been repurchased. The securities discussed may not represent an account’s entire portfolio and, in the aggregate, may represent only a small percentage of an account’s portfolio holdings. The performance attribution presented is of a representative account from Aristotle Atlantic’s Focus Growth Composite. The representative account is a discretionary client account which was chosen to most closely reflect the investment style of the strategy. The criteria used for representative account selection is based on the account’s period of time under management and its similarity of holdings in relation to the strategy. Recommendations made in the last 12 months are available upon request. Returns are presented gross and net of investment advisory fees and include the reinvestment of all income. Gross returns will be reduced by fees and other expenses that may be incurred in the management of the account. Net returns are presented net of actual investment advisory fees and after the deduction of all trading expenses.
All investments carry a certain degree of risk, including the possible loss of principal. Investments are also subject to political, market, currency and regulatory risks or economic developments. International investments involve special risks that may in particular cause a loss in principal, including currency fluctuation, lower liquidity, different accounting methods and economic and political systems, and higher transaction costs. These risks typically are greater in emerging markets. Securities of small‐ and medium‐sized companies tend to have a shorter history of operations, be more volatile and less liquid. Value stocks can perform differently from the market as a whole and other types of stocks.
The material is provided for informational and/or educational purposes only and is not intended to be and should not be construed as investment, legal or tax advice and/or a legal opinion. Investors should consult their financial and tax adviser before making investments. The opinions referenced are as of the date of publication, may be modified due to changes in the market or economic conditions, and may not necessarily come to pass. Information and data presented has been developed internally and/or obtained from sources believed to be reliable. Aristotle Atlantic does not guarantee the accuracy, adequacy or completeness of such information.
Aristotle Atlantic Partners, LLC is an independent registered investment adviser under the Advisers Act of 1940, as amended. Registration does not imply a certain level of skill or training. More information about Aristotle Atlantic, including our investment strategies, fees and objectives, can be found in our Form ADV Part 2, which is available upon request. AAP-2307-22
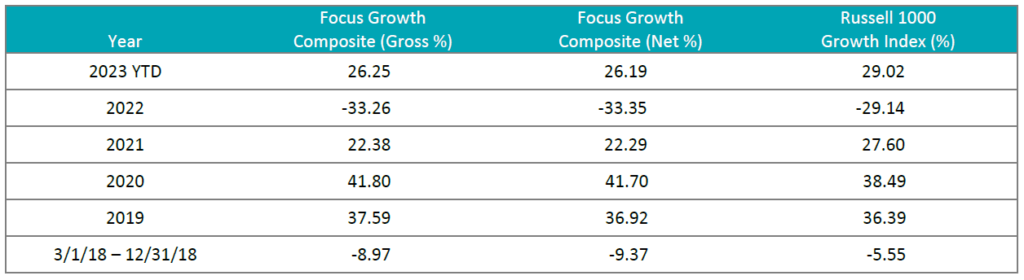
Composite returns for all periods ended June 30, 2023 are preliminary pending final account reconciliation.
Past performance is not indicative of future results. Performance results for periods greater than one year have been annualized. Returns are presented gross and net of investment advisory fees and include the reinvestment of all income. Gross returns will be reduced by fees and other expenses that may be incurred in the management of the account. Net returns are presented net of actual investment advisory fees and after the deduction of all trading expenses.
The Russell 1000® Growth Index measures the performance of the large cap growth segment of the U.S. equity universe. It includes those Russell 1000 companies with higher price-to-book ratios and higher forecasted growth values. This index has been selected as the benchmark and is used for comparison purposes only. The Russell 1000® Value Index measures the performance of the large cap value segment of the U.S. equity universe. It includes those Russell 1000 companies with lower price-to-book ratios and lower expected growth values. The S&P 500® Index is the Standard & Poor’s Composite Index of 500 stocks and is a widely recognized, unmanaged index of common stock prices. The Russell 2000® Index measures the performance of the small cap segment of the U.S. equity universe. The Russell 2000 Index is a subset of the Russell 3000® Index representing approximately 10% of the total market capitalization of that index. It includes approximately 2,000 of the smallest securities based on a combination of their market cap and current index membership. The Dow Jones Industrial Average® is a price-weighted measure of 30 U.S. blue-chip companies. The Index covers all industries except transportation and utilities. The NASDAQ Composite Index measures all NASDAQ domestic and international based common type stocks listed on The NASDAQ Stock Market. The NASDAQ Composite includes over 3,000 companies, more than most other stock market indices. The Bloomberg U.S. Aggregate Bond Index is an unmanaged index of domestic investment grade bonds, including corporate, government and mortgage-backed securities. The WTI Crude Oil Index is a major trading classification of sweet light crude oil that serves as a major benchmark price for oil consumed in the United States. The 3-Month U.S. Treasury Bill is a short-term debt obligation backed by the U.S. Treasury Department with a maturity of three months. The Consumer Price Index (CPI) is a measure of the average change over time in the prices paid by urban consumers for a market basket of consumer goods and services. While stock selection is not governed by quantitative rules, a stock typically is added only if the company has an excellent reputation, demonstrates sustained growth and is of interest to a large number of investors. The volatility (beta) of the Composite may be greater or less than its respective benchmarks. It is not possible to invest directly in these indices.