Commentary
Focus Growth 1Q 2024
Markets Review
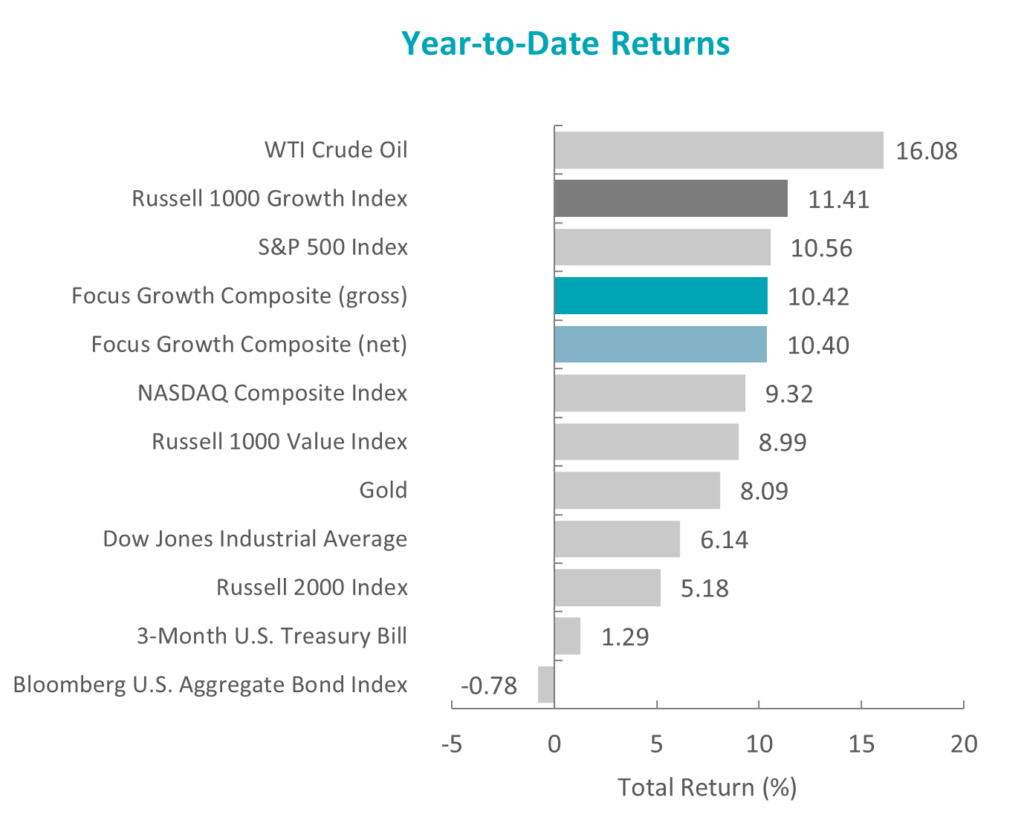
The U.S. equity market continued to rally, as the S&P 500 Index rose 10.56% during the period. Concurrently, the Bloomberg U.S. Aggregate Bond Index fell, returning -0.78% for the quarter. In terms of style, the Russell 1000 Value Index underperformed its growth counterpart by 2.42%.
Sources: CAPS CompositeHubTM, Bloomberg
Past performance is not indicative of future results. Aristotle Atlantic Focus Growth Composite returns are presented gross and net of investment advisory fees and include the reinvestment of all income. Gross returns will be reduced by fees and other expenses that may be incurred in the management of the account. Net returns are presented net of actual investment advisory fees and after the deduction of all trading expenses. Aristotle Atlantic Composite returns are preliminary pending final account reconciliation. Please see important disclosures at the end of this document.
Gains were broad-based, as ten of the eleven sectors within the Russell 1000 Growth index finished higher. The Utilities and Communications Services were the best-performing sectors. Consumer Discretionary had the least gains followed by the Real Estate sector finishing lower for the quarter.
U.S. economic growth remained positive, as real GDP increased at an annual rate of 3.4% in the fourth quarter, though less than the third quarter’s 4.9% reading. The composition of growth was broad-based, having been driven by consumer spending, state and local government investment, and exports. In more recent data, consumer spending increased 0.8% month-over-month in February—the largest gain since January 2023—while housing starts surged 11.6%, touching the highest level in nearly two years. Furthermore, the labor market remained resilient, with unemployment at 3.9% and real average hourly earnings increasing 1.1% year-over-year in February. Meanwhile, inflation, though lower than its level at the end of last year, slightly increased during the quarter, as annual CPI rose from 3.1% in January to 3.2% in February.
Due to continued steady economic growth, the strength of the labor market and higher-than-expected inflation data, the Federal Reserve maintained the benchmark federal funds rate’s targeted range of 5.25% to 5.5% for the fifth consecutive meeting. Chair Powell reaffirmed that the policy rate is likely at its peak for this tightening cycle, but also emphasized that reducing policy restraint too soon or too much could reverse the progress already made by the central bank. However, most recent committee projections indicate that the federal funds rate will be at 4.6% at the end of this year and it will soon be appropriate to slow the pace of the Fed’s balance-sheet runoff.
On the corporate earnings front, results were mixed, as S&P 500 companies reported earnings growth of 4.0%, the second straight quarter of year-over-year growth, but fewer companies exceeded EPS estimates compared to the previous period. Inflation continued to be a major talking point, but companies reported resilient consumer spending, leading to fewer mentions of a potential recession on earnings calls.
Lastly, in U.S. politics, Congress passed, and President Biden signed, the $1.2 trillion spending package that will fund the government for the rest of the fiscal year. In election news, both President Biden and former President Trump secured enough delegates to clinch their parties’ respective nominations, setting up the first presidential rematch in nearly 70 years.
Performance and Attribution Summary
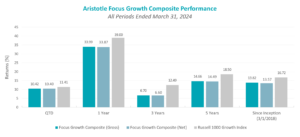
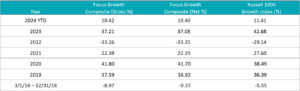
For the first quarter of 2024, Aristotle Atlantic’s Focus Growth Composite posted a total return of 10.42% gross of fees (10.40% net of fees), underperforming the 11.41% total return of the Russell 1000 Growth Index.
| Performance (%) | 1Q24 | 1 Year | 3 Years | 5 Years | Since Inception* |
|---|---|---|---|---|---|
| Focus Growth Composite (gross) | 10.42 | 33.99 | 6.70 | 14.66 | 13.82 |
| Focus Growth Composite (net) | 10.40 | 33.87 | 6.60 | 14.49 | 13.57 |
| Russell 1000 Growth Index | 11.41 | 39.00 | 12.49 | 18.50 | 16.72 |
Sources: FactSet
Past performance is not indicative of future results. Attribution results are based on sector returns which are gross of investment advisory fees. Attribution is based on performance that is gross of investment advisory fees and includes the reinvestment of income. Please see important disclosures at the end of this document.
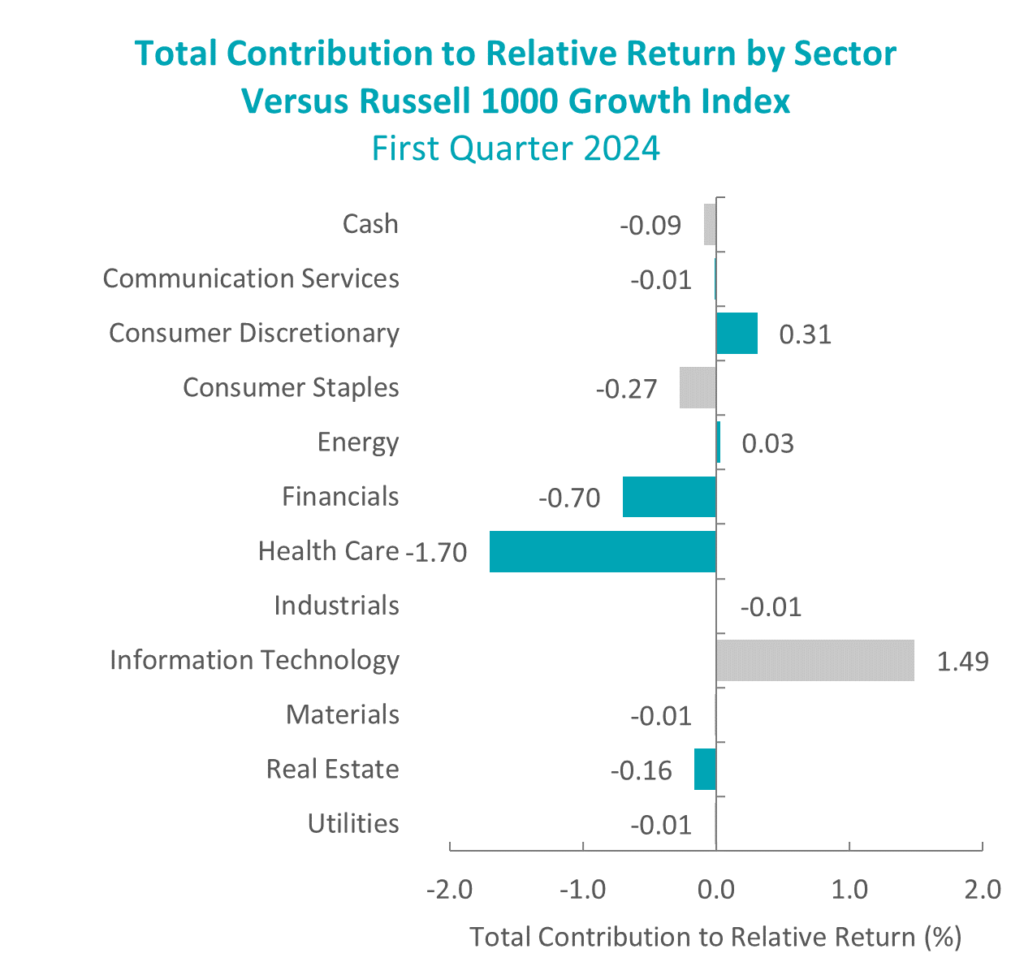
During the first quarter the portfolio’s underperformance relative to the Russell 1000 Growth Index was due to both allocation effects and security selection. Security selection in Health Care and Financials detracted the most from relative returns. Conversely, security selection in Information Technologies and an underweight in Consumer Discretionary contributed the most to relative performance.
Contributors and Detractors for 1Q 2024
| Relative Contributors | Relative Detractors |
|---|---|
| Nvidia | S&P Global |
| Apple | Adaptive Biotechnologies |
| Tesla | Bio-Techne |
| KLA Corporation | Darling Ingredients |
| Netflix | ON Semiconductor |
Contributors
Nvidia
Nvidia contributed to portfolio performance in the first quarter, as the company continues to see accelerating demand for its GPU semiconductors from hyperscalers and enterprises. Nvidia’s GPU semiconductors continue to be the industry-leading building blocks of the accelerated computing data-center architecture to drive AI compute and applications.
Apple
Apple contributed to portfolio performance in the first quarter due to the strategy’s underweight relative to the benchmark. Investors continue to be concerned about weak handset sales globally, as well as declining market share and competitive dynamics in the Chinese market, as Huawei has returned to the market with a more competitive premium-priced handset. Apple has yet to demonstrate a competitive AI product, which could present further competitive headwinds for the company.
Detractors
S&P Global
S&P Global detracted from portfolio performance in the quarter, as shares were weak following a lower-than-expected earnings report and newly issued fiscal year 2024 financial guidance that was slightly below expectations. The company’s lower-than-expected forecast of bond issuance activity for the year was the primary focus of the guidance, although management acknowledged that the guidance is likely conservative, which could result in actual activity exceeding expectations later in the year.
Adaptive Biotechnologies
Adaptive Biotechnologies detracted from portfolio performance in the quarter as investors waited for the outcome of the strategic review. Post quarter-end, Adaptive announced that it plans to continue to run its minimal residual disease (MRD) diagnostic business along with its immune medicine drug discovery business. The company mentioned that after fielding multiple offers for the MRD business, it believes it can attract significantly more value for the asset once it reaches profitability. Adaptive reiterated its plan for EBITDA breakeven in late 2025 and cashflow breakeven in 2026. The company also pre-announced first quarter revenue that came in ~9% ahead of consensus estimates. We believe Adaptive is trading at a very low valuation, and we believe the potential remains strong.
Recent Portfolio Activity
The table below shows all buys and sells completed during the quarter, followed by a brief rationale.
| Buys | Sells |
|---|---|
| Expedia Group | Tesla |
Buys
Expedia Group
Expedia Group provides online travel services for leisure and small business travelers. The company offers a wide range of travel, shopping and reservation services and also provides real-time access to schedule, pricing and availability information for airlines, hotels and car rental companies. Expedia serves customers worldwide.
We see Expedia benefiting from the growth in booking travel online, both for leisure and corporate travel. The company also benefits from rapid growth in alternative accommodations and vacation home rentals through VRBO. The main sources of revenue and profitability are from hotel and vacation home rentals. Additionally, Expedia has exposure to airline ticket sales and automobile rentals. Following the COVID-19 pandemic, Expedia’s debt has been reduced, technology platforms have been rationalized, share repurchase has resumed and we expect a dividend will eventually be reinstated.
Sells
Tesla
We sold Tesla due to deteriorating fundamentals, and there have been significant negative earnings revisions over the past year. Tesla has announced several price cuts to its vehicles and has underscored competition in electric vehicles (EVs) globally. China seems especially competitive. More U.S. EV offerings are expected this year. The Full-Self Driving Capability feature is controversial, has regulatory and litigation risk, and has been chronically late. Elon Musk is trying to gain additional voting shares in Tesla stock. This could present governance issues where his voting share could exceed his economic share of the company.
Outlook
The equity markets in the first quarter finished strong despite a rise in interest rates from year end. The move in interest rates is due to inflation staying above the targeted level set by the Federal Reserve. Expectations for a 2024 rate reduction have been pushed out into the back half of the year. A resilient U.S. economy has provided support for higher corporate profits. The first quarter double-digit returns on top of a very strong fourth quarter leave equity valuations at the high end of historical averages. The continued uncertainty around geopolitical tensions and the pending US Presidential election will add to market volatility. Although a pause in equity prices is likely, higher earnings and an easing interest rate cycle should help support equity prices for the balance of the year. Our focus will continue to be at the company level, with an emphasis on seeking to invest in companies with secular tailwinds or strong product-driven cycles.
The opinions expressed herein are those of Aristotle Atlantic Partners, LLC (Aristotle Atlantic) and are subject to change without notice. Past performance is not a guarantee or indicator of future results. This material is not financial advice or an offer to purchase or sell any product. You should not assume that any of the securities transactions, sectors or holdings discussed in this report were or will be profitable, or that recommendations Aristotle Atlantic makes in the future will be profitable or equal the performance of the listed in this report. The portfolio characteristics shown relate to the Aristotle Atlantic Focus Growth strategy. Not every client’s account will have these characteristics. Aristotle Atlantic reserves the right to modify its current investment strategies and techniques based on changing market dynamics or client needs. There is no assurance that any securities discussed herein will remain in an account’s portfolio at the time you receive this report or that securities sold have not been repurchased. The securities discussed may not represent an account’s entire portfolio and, in the aggregate, may represent only a small percentage of an account’s portfolio holdings. The performance attribution presented is of a representative account from Aristotle Atlantic’s Focus Growth Composite. The representative account is a discretionary client account which was chosen to most closely reflect the investment style of the strategy. The criteria used for representative account selection is based on the account’s period of time under management and its similarity of holdings in relation to the strategy. Recommendations made in the last 12 months are available upon request. Returns are presented gross and net of investment advisory fees and include the reinvestment of all income. Gross returns will be reduced by fees and other expenses that may be incurred in the management of the account. Net returns are presented net of actual investment advisory fees and after the deduction of all trading expenses.
All investments carry a certain degree of risk, including the possible loss of principal. Investments are also subject to political, market, currency and regulatory risks or economic developments. International investments involve special risks that may in particular cause a loss in principal, including currency fluctuation, lower liquidity, different accounting methods and economic and political systems, and higher transaction costs. These risks typically are greater in emerging markets. Securities of small‐ and medium‐sized companies tend to have a shorter history of operations, be more volatile and less liquid. Value stocks can perform differently from the market as a whole and other types of stocks.
The material is provided for informational and/or educational purposes only and is not intended to be and should not be construed as investment, legal or tax advice and/or a legal opinion. Investors should consult their financial and tax adviser before making investments. The opinions referenced are as of the date of publication, may be modified due to changes in the market or economic conditions, and may not necessarily come to pass. Information and data presented has been developed internally and/or obtained from sources believed to be reliable. Aristotle Atlantic does not guarantee the accuracy, adequacy or completeness of such information.
Aristotle Atlantic Partners, LLC is an independent registered investment adviser under the Advisers Act of 1940, as amended. Registration does not imply a certain level of skill or training. More information about Aristotle Atlantic, including our investment strategies, fees and objectives, can be found in our Form ADV Part 2, which is available upon request. AAP-2404-22
Sources: CAPS CompositeHubTM, Russell Investments
Composite returns for all periods ended March 31, 2024 are preliminary pending final account reconciliation.
Past performance is not indicative of future results. Performance results for periods greater than one year have been annualized. Returns are presented gross and net of investment advisory fees and include the reinvestment of all income. Gross returns will be reduced by fees and other expenses that may be incurred in the management of the account. Net returns are presented net of actual investment advisory fees and after the deduction of all trading expenses.
The Russell 1000® Growth Index measures the performance of the large cap growth segment of the U.S. equity universe. It includes those Russell 1000 companies with higher price-to-book ratios and higher forecasted growth values. This index has been selected as the benchmark and is used for comparison purposes only. The Russell 1000® Value Index measures the performance of the large cap value segment of the U.S. equity universe. It includes those Russell 1000 companies with lower price-to-book ratios and lower expected growth values. The S&P 500® Index is the Standard & Poor’s Composite Index of 500 stocks and is a widely recognized, unmanaged index of common stock prices. The Russell 2000® Index measures the performance of the small cap segment of the U.S. equity universe. The Russell 2000 Index is a subset of the Russell 3000® Index representing approximately 10% of the total market capitalization of that index. It includes approximately 2,000 of the smallest securities based on a combination of their market cap and current index membership. The Dow Jones Industrial Average® is a price-weighted measure of 30 U.S. blue-chip companies. The Index covers all industries except transportation and utilities. The NASDAQ Composite Index measures all NASDAQ domestic and international based common type stocks listed on The NASDAQ Stock Market. The NASDAQ Composite includes over 3,000 companies, more than most other stock market indices. The Bloomberg U.S. Aggregate Bond Index is an unmanaged index of domestic investment grade bonds, including corporate, government and mortgage-backed securities. The WTI Crude Oil Index is a major trading classification of sweet light crude oil that serves as a major benchmark price for oil consumed in the United States. The 3-Month U.S. Treasury Bill is a short-term debt obligation backed by the U.S. Treasury Department with a maturity of three months. The Consumer Price Index (CPI) is a measure of the average change over time in the prices paid by urban consumers for a market basket of consumer goods and services. While stock selection is not governed by quantitative rules, a stock typically is added only if the company has an excellent reputation, demonstrates sustained growth and is of interest to a large number of investors. The volatility (beta) of the Composite may be greater or less than its respective benchmarks. It is not possible to invest directly in these indices.