Commentary
Focus Growth 1Q 2023
Markets Review
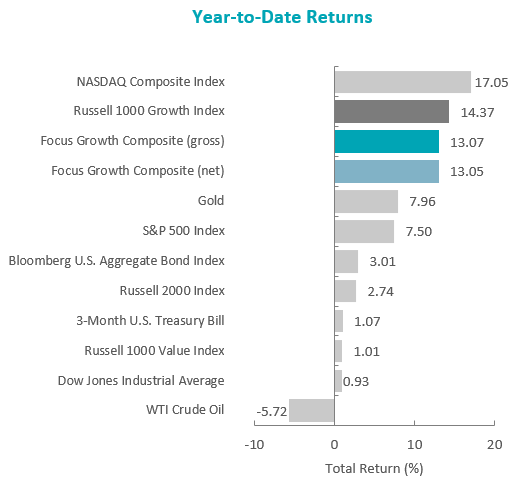
The U.S. equity market finished higher for the first quarter of the year, as the S&P 500 Index rose 7.50% during the period. Concurrently, the Bloomberg U.S. Aggregate Bond Index increased 2.96% for the quarter. In terms of style, the Russell 1000 Growth Index outperformed its value counterpart by 13.36% during the quarter.
Sources: SS&C Advent, Bloomberg
Past performance is not indicative of future results. Aristotle Atlantic Focus Growth Composite returns are presented gross and net of investment advisory fees and include the reinvestment of all income. Gross returns will be reduced by fees and other expenses that may be incurred in the management of the account. Net returns are presented net of actual investment advisory fees and after the deduction of all trading expenses. Aristotle Atlantic Composite returns are preliminary pending final account reconciliation. Please see important disclosures at the end of this document.
Seven out of the eleven sectors within the Russell 1000 Value Index finished higher for the quarter, with Communication Services, Information Technology and Consumer Discretionary gaining the most. Meanwhile, Health Care, Financials and Energy were the worst-performing sectors.
Although inflation remained well above its historical average of 3.26%, the pace of price increases moderated during the quarter. As such, for the 12-month periods ending in January and February, annualized CPI figures declined from 6.4% to 6.0%, respectively. The pattern of disinflation was partly driven by decreases in the price of fuel, used vehicles and medical care services. The government also reported a deceleration in U.S. economic growth, as GDP increased 2.6% in the fourth quarter following the third quarter’s 3.2% increase. Weaker consumer spending and business investment were significant factors in the softer results. However, retail sales in January jumped 3%, and the labor market remained tight, with an unemployment rate of 3.6%.
While some economic data points trended in a positive direction, the market was shocked with the regulatory shutdown of Silicon Valley Bank (SVB), the second-largest bank failure by assets in U.S. history. The value of SVB’s bond holdings had plunged amid rapidly increasing interest rates, creating a shortfall as clients (largely composed of tech startups) withdrew their deposits, eventually leading to a run on the bank’s deposits. Just days later, regulators also took control of New York-based Signature Bank. The speed and size of the bank failures sent U.S. bank share prices tumbling. To provide stability, the Federal Reserve announced the creation of an emergency lending facility that would allow banks to deposit high-quality assets (e.g., Treasuries and mortgage-backed securities) in exchange for a cash advance worth the face value of the asset (instead of the market value). Additionally, First Citizens Bank announced that it had made an agreement with the Federal Deposit Insurance Corporation (FDIC) for a whole bank purchase with loss share coverage of Silicon Valley Bridge Bank.1
Despite the turmoil in the banking system, the Federal Reserve (Fed) stayed its course, increasing its benchmark rate by 0.25% in March (its ninth consecutive rate hike) to a range of 4.75% to 5.00%. However, noting that banking events may contribute to a more restrictive credit environment, the Fed tempered its stance that further rate increases are necessary to restore price stability and achieve its 2% inflation target. Rather, Fed Chair Powell emphasized the reliance on incoming data to inform the future path of monetary policy, as conditions may have tightened more than economic indices currently suggest.
On the corporate earnings front, results and guidance were broadly underwhelming, with only 68% of S&P 500 companies exceeding EPS estimates (below the five-year average of 77%) and 67% of companies providing negative EPS guidance (above the five-year average of 59%). Overall, the S&P 500 companies reported a decline in earnings of 4.9% as inflation and recession remained prevalent topics, with 332 and 148 companies mentioning those words on earnings calls, respectively. Nevertheless, in spite of the weaker-than-expected results, there have also been positive remarks of cost cutting, moderating input price pressures and better supply-chain dynamics.
Performance and Attribution Summary
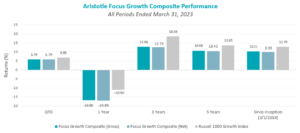
For the first quarter of 2023, Aristotle Atlantic’s Focus Growth Composite posted a total return of 13.05% net of fees (13.07% gross of fees), underperforming the 14.37% total return of the Russell 1000 Growth Index.
| Performance (%) | 1Q23 | 1 Year | 3 Years | 5 Years | Since Inception* |
|---|---|---|---|---|---|
| Focus Growth Composite (gross) | 13.07 | -16.80 | 12.86 | 10.68 | 10.21 |
| Focus Growth Composite (net) | 13.05 | -16.89 | 12.75 | 10.42 | 9.95 |
| Russell 1000 Growth Index | 14.37 | -10.90 | 18.58 | 13.65 | 12.79 |
Sources: FactSet
Past performance is not indicative of future results. Attribution results are based on sector returns which are gross of investment advisory fees. Attribution is based on performance that is gross of investment advisory fees and includes the reinvestment of income. Please see important disclosures at the end of this document.
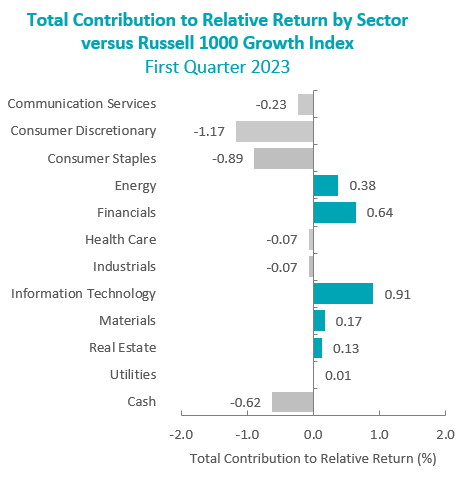
During the first quarter, the portfolio’s underperformance relative to the Russell 1000 Growth Index was due to allocation effects, while security selection modestly contributed. Security selection in Consumer Discretionary and Consumer Staples, as well as an overweight in Health Care detracted the most from performance. Conversely, security selection in Information Technology, Financials and Health Care contributed to relative results.
Contributors and Detractors for 1Q 2023
| Relative Contributors | Relative Detractors |
|---|---|
| Nvidia | Tesla |
| MSCI | Dollar General |
| IDEXX Laboratories | Darling Ingredients |
| CrowdStrike Holdings | Norfolk Southern |
| ON Semiconductor | Bio-Techne |
Contributors
Nvidia
Nvidia contributed to outperformance, as the company announced better-than-expected fourth quarter earnings driven by a strong rebound in Gaming and an improving outlook for the Datacenter business due to the acceleration of Graphics Processing Unit (GPU) driven Artifical Intelligence (AI) deployment. The company also hosted its Global Technology Conference (GTC) in March where it further highlighted its leading technology being used to develop AI Large Language Models (LLM). The company announced new partnerships with hyperscalers for its AI cloud-based service while also releasing new software and hardware offerings that will support GPU-driven AI growth. Nvidia continues to see a growing addressable market for its products and services as AI uses become more prevalent.
MSCI
MSCI contributed to performance in the first quarter following better-than-expected fourth quarter earnings results, highlighting the company’s ability to grow despite macroeconomic headwinds. Management continued focusing on expense efficiency gains while investing in long-term growth opportunities. MSCI reiterated its bullish view on its ESG/Climate business outlook.
Detractors
Tesla
Tesla was a negative contributor to performance due to our underweight position relative to Russell 1000 Growth Index, as the company had strong performance in Q1. The strength occurred after the company partially reversed a previously announced price cut for its electric vehicles following a period of strong demand. Tesla also reported better-than-expected results for Q4 2022 during the first quarter.
Dollar General
Dollar General shares underperformed on a rotation out of more defensive consumer names at the start of the year despite growing concerns of a slowdown in the economy and the coinciding effects on consumer spending. During the first quarter, Dollar General reported solid comps, as their core lower-income consumer remained resilient despite rising inflation.
Recent Portfolio Activity
The table below shows all buys and sells completed during the quarter, followed by a brief rationale.
| Buys | Sells |
|---|---|
| ON Semiconductor | Horizon Therapeutics |
| Tesla |
Buys
ON Semiconductor
ON Semiconductor supplies analog, standard logic and discrete semiconductors for data and power management. The company provides industry leading intelligent sensing and power solutions to help its customers solve the most challenging problems and create cutting edge products for a better future. Its extensive portfolio of sensors, power management, connectivity, custom and SoC, analog, logic, timing and discrete devices helps customers efficiently solve design challenges in advanced electronic systems and products. ON Semiconductor’s devices perform power and signal control, and interface functions appear in a wide range of end-user markets including automotive, communications, computing, consumer, medical, industrial, networking, telecom and aerospace/defense. Most of ON Semiconductor’s sales come from the Asia/Pacific region.
We see ON Semiconductor attractively valued and leveraged to attractive areas of end-market growth over the next few years. The company is gaining both semiconductor content and seeing better pricing tailwinds due to demand exceeding supply and more complex semiconductor content. We see these trends continuing to provide 2023 tailwinds and fully expect strong growth rates in electric vehicle penetration over the next five years.
Tesla
Tesla Motors designs, develops, manufactures, and markets high-performance, technologically advanced electric cars and solar energy generation and energy storage products. Tesla sells more than five fully electric cars, among others, the Model X and Y SUVs, as well as the Model S sedan and Model 3 sedan. The company has a growing global network of Tesla Superchargers, which are industrial grade, high-speed vehicle chargers, typically placed along well-traveled routes and in and around dense city centers to allow Tesla owners quick and reliable charging. Tesla offers certain advanced driver assist systems under its Autopilot and Full Self-Driving options. US customers generate nearly half of Tesla’s sales.
We see Tesla as the leading manufacturer of battery powered electric vehicles (EVs). The company has achieved scaled production of EVs before the other large automobile manufacturers. The company’s technology in battery production and self-driving technology is more mature than competitors’ offerings. EVs are one of the fastest growing categories within automobile manufacturing. The profit margin in the automotive segment is significantly above automotive competitors which provides the company flexibility to price its vehicles more strategically as the competition eventually scales up their EV production. The direct-to-consumer sales model gives the company more control over its relationship with its customers as well as a source of higher profit margin since there is no dealership share of the profits.
Sells
Horizon Therapeutics
We sold Horizon after Amgen announced their intention to acquire Horizon for $116.50 per share. The deal is expected to close in mid-year 2023.
Outlook
The impact of the Federal Reserve tightening cycle and the banking issues of the past month added to the concern of a potential economic recession. With goods inflation largely under control, labor costs will remain the focal point to achieving the stated goal of 2% inflation. With the labor market still tight, the Federal Reserve may well raise rates another 25 basis points with the peak in Fed Funds at 5.00% to 5.25%. Fed Funds Futures continue to point to the potential for a pivot into an easing cycle and this has supported the rise in equity prices. We believe the most likely outcome is for the Federal Reserve to pause for a period to access the impact to inflation of the rise in interest rates and shrinking of the balance sheet. Equity markets will focus on the impact this has had on the economy and the potential for a contraction in corporate profits. Equity valuation levels remain elevated and with the prospects for a decline in profits this sets up for a difficult path for higher equity prices. The major support continues to be the prospect of a shift to a Federal Reserve easing cycle. Little progress has been made in dealing with the Debt Ceiling which will add a level of uncertainty and volatility to markets. With the war in Ukraine passing the one-year mark, there has been no progress toward a resolution adding to the uncertainty. With many of the sizable legislative packages passed now entering the phase of rule writing, markets will have more clarity on where these funds will flow. This should be one of the bright spots in a challenging economic outlook. Our focus will continue to be at the company level, with an emphasis on seeking to invest in companies with secular tailwinds or strong product-driven cycles.
The opinions expressed herein are those of Aristotle Atlantic Partners, LLC (Aristotle Atlantic) and are subject to change without notice. Past performance is not a guarantee or indicator of future results. This material is not financial advice or an offer to purchase or sell any product. You should not assume that any of the securities transactions, sectors or holdings discussed in this report were or will be profitable, or that recommendations Aristotle Atlantic makes in the future will be profitable or equal the performance of the listed in this report. The portfolio characteristics shown relate to the Aristotle Atlantic Focus Growth strategy. Not every client’s account will have these characteristics. Aristotle Atlantic reserves the right to modify its current investment strategies and techniques based on changing market dynamics or client needs. There is no assurance that any securities discussed herein will remain in an account’s portfolio at the time you receive this report or that securities sold have not been repurchased. The securities discussed may not represent an account’s entire portfolio and, in the aggregate, may represent only a small percentage of an account’s portfolio holdings. The performance attribution presented is of a representative account from Aristotle Atlantic’s Focus Growth Composite. The representative account is a discretionary client account which was chosen to most closely reflect the investment style of the strategy. The criteria used for representative account selection is based on the account’s period of time under management and its similarity of holdings in relation to the strategy. Recommendations made in the last 12 months are available upon request. Returns are presented gross and net of investment advisory fees and include the reinvestment of all income. Gross returns will be reduced by fees and other expenses that may be incurred in the management of the account. Net returns are presented net of actual investment advisory fees and after the deduction of all trading expenses.
All investments carry a certain degree of risk, including the possible loss of principal. Investments are also subject to political, market, currency and regulatory risks or economic developments. International investments involve special risks that may in particular cause a loss in principal, including currency fluctuation, lower liquidity, different accounting methods and economic and political systems, and higher transaction costs. These risks typically are greater in emerging markets. Securities of small‐ and medium‐sized companies tend to have a shorter history of operations, be more volatile and less liquid. Value stocks can perform differently from the market as a whole and other types of stocks.
The material is provided for informational and/or educational purposes only and is not intended to be and should not be construed as investment, legal or tax advice and/or a legal opinion. Investors should consult their financial and tax adviser before making investments. The opinions referenced are as of the date of publication, may be modified due to changes in the market or economic conditions, and may not necessarily come to pass. Information and data presented has been developed internally and/or obtained from sources believed to be reliable. Aristotle Atlantic does not guarantee the accuracy, adequacy or completeness of such information.
Aristotle Atlantic Partners, LLC is an independent registered investment adviser under the Advisers Act of 1940, as amended. Registration does not imply a certain level of skill or training. More information about Aristotle Atlantic, including our investment strategies, fees and objectives, can be found in our Form ADV Part 2, which is available upon request. AAP-2304-31

Composite returns for all periods ended March 31, 2023 are preliminary pending final account reconciliation.
Past performance is not indicative of future results. Performance results for periods greater than one year have been annualized. Returns are presented gross and net of investment advisory fees and include the reinvestment of all income. Gross returns will be reduced by fees and other expenses that may be incurred in the management of the account. Net returns are presented net of actual investment advisory fees and after the deduction of all trading expenses.
The Russell 1000® Growth Index measures the performance of the large cap growth segment of the U.S. equity universe. It includes those Russell 1000 companies with higher price-to-book ratios and higher forecasted growth values. This index has been selected as the benchmark and is used for comparison purposes only. The Russell 1000® Value Index measures the performance of the large cap value segment of the U.S. equity universe. It includes those Russell 1000 companies with lower price-to-book ratios and lower expected growth values. The S&P 500® Index is the Standard & Poor’s Composite Index of 500 stocks and is a widely recognized, unmanaged index of common stock prices. The Russell 2000® Index measures the performance of the small cap segment of the U.S. equity universe. The Russell 2000 Index is a subset of the Russell 3000® Index representing approximately 10% of the total market capitalization of that index. It includes approximately 2,000 of the smallest securities based on a combination of their market cap and current index membership. The Dow Jones Industrial Average® is a price-weighted measure of 30 U.S. blue-chip companies. The Index covers all industries except transportation and utilities. The NASDAQ Composite Index measures all NASDAQ domestic and international based common type stocks listed on The NASDAQ Stock Market. The NASDAQ Composite includes over 3,000 companies, more than most other stock market indices. The Bloomberg U.S. Aggregate Bond Index is an unmanaged index of domestic investment grade bonds, including corporate, government and mortgage-backed securities. The WTI Crude Oil Index is a major trading classification of sweet light crude oil that serves as a major benchmark price for oil consumed in the United States. The 3-Month U.S. Treasury Bill is a short-term debt obligation backed by the U.S. Treasury Department with a maturity of three months. The Consumer Price Index (CPI) is a measure of the average change over time in the prices paid by urban consumers for a market basket of consumer goods and services. While stock selection is not governed by quantitative rules, a stock typically is added only if the company has an excellent reputation, demonstrates sustained growth and is of interest to a large number of investors. The volatility (beta) of the Composite may be greater or less than its respective benchmarks. It is not possible to invest directly in these indices.