Commentary
International Equity 3Q 2022
(All MSCI index returns are shown net and in U.S. dollars unless otherwise noted.)
Markets Review
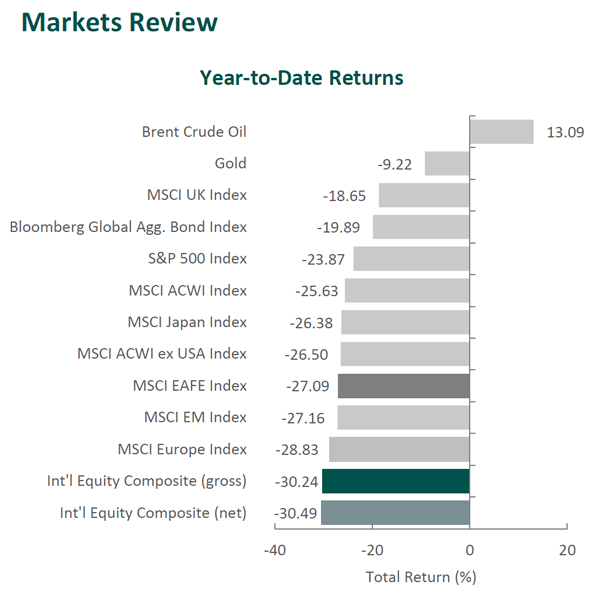
Global equity markets finished lower for the third consecutive quarter. Overall, the MSCI ACWI Index dropped 6.82% during the period, bringing its year-to-date return to -25.63%. Concurrently, the Bloomberg Global Aggregate Bond Index pulled back 6.94%, bringing its year-to-date return to -19.89%. In terms of style, growth stocks outperformed their value counterparts during the quarter, with the MSCI ACWI Growth Index beating the MSCI ACWI Value Index by 1.73%. Nevertheless, for the year-to-date period, the MSCI ACWI Value Index has outperformed the MSCI ACWI Growth Index by 13.14%.

Sources: SS&C Advent, Bloomberg
Past performance is not indicative of future results. Aristotle International Equity Composite returns are presented gross and net of investment advisory fees and include the reinvestment of all income. Gross returns will be reduced by fees and other expenses that may be incurred in the management of the account. Net returns are presented net of actual investment advisory fees and after the deduction of all trading expenses. Aristotle Capital Composite returns are preliminary pending final account reconciliation. Please see important disclosures at the end of this document.
The MSCI EAFE Index dropped 9.36% during the third quarter, while the MSCI ACWI ex USA Index decreased 9.91%. Regionally, the U.K. and Europe & Middle East were the weakest performers, while Asia declined the least. On a sector basis, all eleven sectors within the MSCI EAFE Index posted negative returns, with Communication Services, Utilities and Real Estate generating the largest losses. Conversely, Energy, Consumer Staples and Information Technology declined the least.
As energy prices inflicted pain across much of the world, and the tensions between East and West became more pronounced, the outlook for global economic activity and inflation continued to worsen. The IMF now projects global growth to slow from 6.1% in 2021 to 3.2% in 2022 versus the 3.6% projection last quarter. The IMF also raised its 2022 inflation estimates to 6.6% for advanced economies and 9.5% for developing economies.
In response to elevated inflation, many central banks tightened monetary policy during the quarter. With two 0.75% increases, the U.S. Federal Reserve raised its benchmark rate to a range of 3.00% to 3.25%. The European Central Bank also raised its benchmark lending rate from 0.00% to 1.25%—its first hike in eleven years—while the Bank of England, with two 0.50% increases, raised its benchmark rate to 2.25%. Meanwhile, Japan continues to maintain its ultra-low interest rates, and China’s central bank cut key policy rates.
The divergence in monetary policies between the U.S. Federal Reserve and other central banks, plus concerns for slowing global growth, sent the U.S. Dollar Index (DXY) to a two-decade high. Currencies such as the Euro and Yen have lost approximately 14% and 20% in relative value, respectively, year-to-date. The rapid one-sided movement in the foreign exchange market caused the Bank of Japan to intervene and strengthen the Yen for the first time in 24 years.
The U.K. gathered the world’s attention this quarter, as Queen Elizabeth II—the second-longest reigning monarch in world history—passed away in September, leaving the throne to her son King Charles III. A new government was also installed after Boris Johnson resigned. He was replaced in a special election by current Prime Minister Liz Truss, a fellow member of the Conservative Party. However, Prime Minister Truss’s plan to help citizens afford energy through tax cuts and subsidies stood in contrast to the Bank of England’s efforts to curb inflation. The mixed messages resulted in a sharp sell-off in U.K. government bonds, forcing England’s central bank to reverse its stance toward quantitative tightening to prop up tumbling gilt prices.
Outside of the U.K., Russia’s ongoing invasion of Ukraine has not only caused tragic human suffering and loss of life, but is also threatening European countries’ ability to procure natural gas ahead of winter. Sanctions, pipeline issues and the surge in prices have revealed Europe’s acute need for new energy sources—independent of Russia. In addition, U.S. and Chinese relations became further strained in August following Nancy Pelosi’s visit to Taiwan, only to be compounded by President Biden’s statement that the U.S. military could be used to defend the island. These events have served to exacerbate already heightened global economic uncertainty.
Performance and Attribution Summary
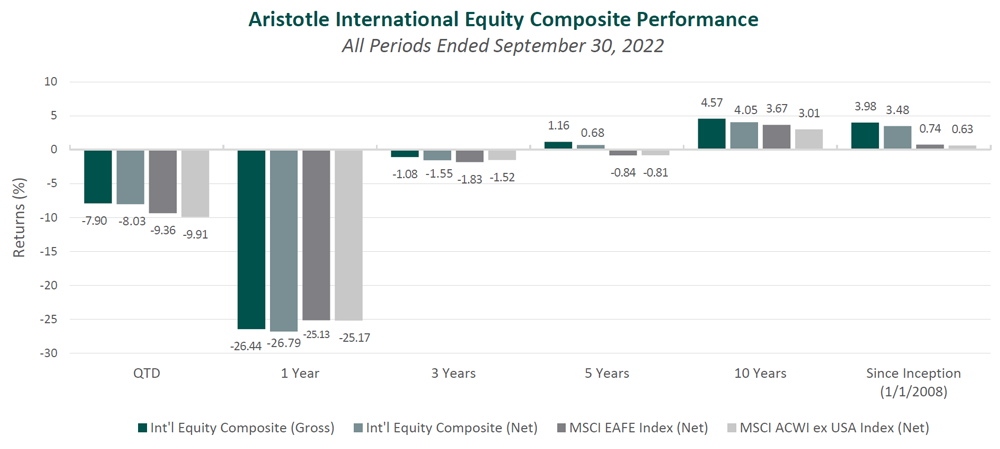
For the third quarter of 2022, Aristotle Capital’s International Equity Composite posted a total return of -7.90% gross of fees (-8.03% net of fees), outperforming the MSCI EAFE Index, which returned -9.36%, and the MSCI ACWI ex USA Index, which returned -9.91%. Please refer to the table below for detailed performance.
| Performance (%) | 3Q22 | YTD | 1 Year | 3 Years | 5 Years | 10 Years | Since Inception* |
|---|---|---|---|---|---|---|---|
| International Equity Composite (gross) | -7.90 | -30.24 | -26.44 | -1.08 | 1.16 | 4.57 | 3.98 |
| International Equity Composite (net) | -8.03 | -30.49 | -26.79 | -1.55 | 0.68 | 4.05 | 3.48 |
| MSCI EAFE Index (net) | -9.36 | -27.09 | -25.13 | -1.83 | -0.84 | 3.67 | 0.74 |
| MSCI ACWI ex USA Index (net) | -9.91 | -26.50 | -25.17 | -1.52 | -0.81 | 3.01 | 0.63 |

Source: FactSet
Past performance is not indicative of future results. Attribution results are based on sector returns which are gross of investment advisory fees. Attribution is based on performance that is gross of investment advisory fees and includes the reinvestment of income.
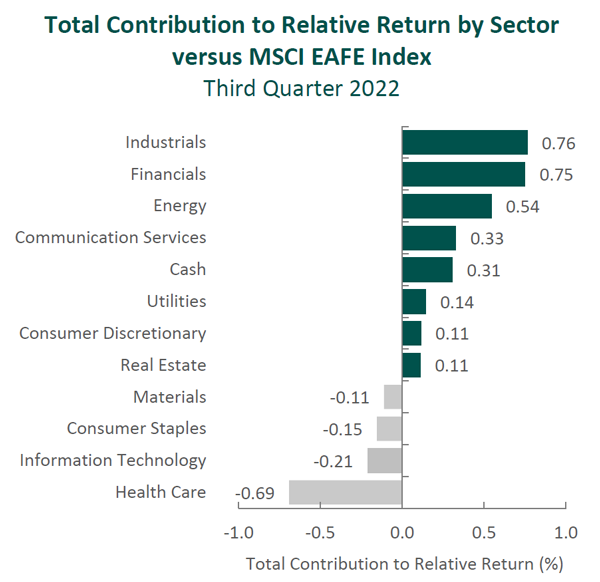
From a sector perspective, the portfolio’s outperformance relative to the MSCI EAFE Index can be attributed to both security selection and allocation effects. Security selection in Industrials, Financials and Energy contributed the most to the portfolio’s relative performance. Conversely, security selection in Health Care, Information Technology and Consumer Staples detracted from relative return.
Regionally, both security selection and allocation effects were responsible for the portfolio’s outperformance. Exposure to Canada and security selection in the U.K. contributed the most to relative performance, while an underweight in Asia and an overweight in the U.K. detracted.
Contributors and Detractors for 3Q 2022
| Relative Contributors | Relative Detractors |
|---|---|
| Cameco | GSK |
| Pan Pacific International | Sony |
| Ashtead Group | Nemetschek |
| DBS Group | AIA Group |
| Munich Re Group | Amundi |
Cameco, the world’s largest publicly traded uranium producer, was the top contributor for the quarter. In order to pivot away from a reliance on Russian energy without jeopardizing net-zero commitments, policymakers and businesses have (finally) turned their attention toward nuclear power generation. Germany extended the life of two nuclear power plants, and Japan announced it will look at extending the life of existing reactors, restart additional idle reactors and look at developing next-generation reactors. These shifts in energy policies have increased demand at a time of tight supply. Although such market dynamics will likely favor Cameco in the short term, we believe the company’s continued focus on supply discipline will help ensure long-term success as well. By obtaining long-term contracts and slowly ramping production, we believe Cameco is well positioned in the changing energy landscape. The company has already recorded 45 million pounds in new long-term uranium contracts this year, with additional contract discussions underway. Furthermore, Cameco increased its ownership in Cigar Lake by 4.52%, bringing its ownership stake to 54.55%. This ownership expansion, combined with investment in operational readiness for McArthur River/Key Lake, should allow the company to continue to meet utility customers’ changing and growing long-term demand. This sets the stage for Cameco to execute on our catalyst of increasing its uranium volume sold at higher prices, all while lowering production costs through scale and its access to some of the highest-grade ore on the planet.
DBS Group, Singapore’s largest bank1 was a leading contributor. We have long been attracted to the Singapore banking industry due to its oligopoly structure and the stability of the country’s regulatory environment, as well as its fiscal and monetary policies. Part of this stability is attributable to the central bank’s long-standing currency monitoring band, which has kept the Singapore dollar tightly linked to the U.S. dollar. In our opinion, outside of a robust first half 2022 earnings report, the quarter contained nothing material from a catalyst or fundamental perspective. As such, we believe this quarter’s stock price performance was likely due to U.S. dollar strength—something we do not attempt to predict. We continue to admire DBS’s leadership in digital banking, which we believe should allow the company to drive further efficiency gains. Moreover, we continue to monitor DBS’s pending acquisition of Citigroup’s consumer banking business in Taiwan; this acquisition should bolster our ongoing catalyst of profitable expansion outside of Singapore.
1As measured by assets as of June 30, 2022.
GSK, the U.K.-headquartered pharmaceutical company, was the largest detractor. GSK completed the demerger of its consumer health business in July, creating the independent, publicly traded company Haleon. As discussed below, we made Haleon a full position following the spinoff. We believe the separation unlocks value and allows remaining GSK to benefit from greater focus on biopharmaceuticals and vaccines. After managing the completed spinoff, CFO Iain Mackay announced his plans to retire in May 2023, to be replaced by Julie Brown. Having served in previous CFO posts at both the luxury goods brand Burberry, as well as the pharmaceutical firm AstraZeneca, we look forward to following Ms. Brown’s initiatives at GSK. Moreover, the company has been advancing on our catalyst of market share gains for Shingrix, its vaccine to prevent shingles. Shingrix again delivered record sales growth and continues to be a key driver of GSK’s vaccine revenue expansion. Lastly, legal concerns related to potential side effects from the heartburn medicine Zantac made headlines. Although Zantac was marketed by several firms and its associated risks have been known for a number of years, upcoming lawsuits in the U.S. received media attention this quarter. We are closely following the litigation and may have more to share in future commentaries. In the interim, we find the price adjustment to be overdone. The largest side effect-related drug settlements have been in the single-digit billions, while more than £20 billion in market capitalization has been removed from GSK. Despite recent share price declines, we remain confident in GSK’s ability to further penetrate markets with its current products and evolve its pipeline of innovative medicines.
Sony, the global provider of videogames and consoles, image sensors, and music, as well as movies, was a major detractor for the period. The share price of the company has struggled this year following its strong performance in 2021. Signs of a slowdown in the gaming industry (as people seem inclined to take on outdoor activities as pandemic fears have subsided), combined with sales of its PlayStation 5 that have been held up by a global parts shortage, have led to gaming-related software sales falling more than 20% year-over-year. Rather than focusing on short-term demand dislocations, we focus on the company’s ability to continue migrating videogame users toward the firm’s subscription offerings, as well as its capacity to leverage content across its video, music and gaming platforms. We are also impressed with the expansion of Sony’s Music segment, which has been supported by the pervasiveness of streaming services. Management’s ongoing work to improve the company’s TV and film studios is bearing fruit as well, with sales growing 67% year-over-year for its Pictures segment as its regional strategy has taken hold, including recent progress made toward solidifying a merger plan with India-based Zee Entertainment.
Recent Portfolio Activity
| Buys | Sells |
|---|---|
| Haleon | Reckitt |
We have owned shares of Reckitt—the global manufacturer and marketer of household, health and personal care products—for over a decade, having become investors in the second quarter of 2011. The company’s well-known brands include Mucinex, Dr. Scholl’s, Woolite and Lysol. During our holding period, Reckitt executed on some, but not all, of our catalysts. In particular, the 2017 acquisition of Mead Johnson increased its emerging markets presence by expanding the company’s offerings in China; however, the acquisition came at too high of a cost in our opinion. The fresh perspective Laxman Narasimhan brought when he joined as CEO in 2019, which was reflected in his reorganization of the Health and Hygiene units and a shift toward higher-margin products, was another catalyst we identified. While we still view Reckitt as a high-quality business, with many of its catalysts now closer to completion, we decided to exit our position in favor of what we consider to be a more optimal opportunity in Haleon, which is discussed below.
Haleon plc
Haleon, headquartered in the U.K., is currently the only publicly traded, pure-play global consumer health company. The company has existed for decades in various forms and, through a history of M&A, is the product of three major pharmaceutical companies’ assets: GSK, Novartis and Pfizer. With roughly £9.5 billion in revenue, Haleon operates in over 170 markets, selling products in oral health (~28% of 2021 revenue), pain relief (~23%), digestive health (~21%), vitamin and mineral supplements (~16%), and respiratory health (~12%). Its recognizable brands include Sensodyne toothpaste, the pain relief product Advil, Theraflu for cold and flu symptoms, and Centrum multivitamins.
Haleon was spun off this summer by existing holding GSK. Impressed by this consumer health products business, we decided to increase our ownership to a full weight in the portfolio.
Quality
Some of the quality characteristics we have identified for Haleon include:
– Portfolio of well-known brands, supported by a history of innovation and doctors’ advocacy;
– Market leadership in different categories across the world’s fragmented consumer health industry, including number one positions in digestive health and vitamin and mineral supplements; and
– Global reach and diversification across geographies and categories, with a track record of improving EBITDA margins and stable FREE cash flow generation.
Attractive Valuation
Given our estimates of higher normalized earnings, both due to further product penetration and efficiency gains as a standalone enterprise, we believe the company is offered at an attractive price. In addition, we recognize the risks associated with the recent Zantac lawsuits and believe this is more than reflected in the current stock price.
Compelling Catalysts
Catalysts we have identified for Haleon, which we believe will cause its stock price to appreciate over our three- to five-year investment horizon, include:
– Enhanced profitability and increased revenue, as many of its products, including what the company refers to as its higher-margin “power brands,” are better supported for growth by the company’s ability to make its own capital allocation decisions;
– Benefits from being managed as an independent company that should spur improved business structures and innovation efforts; and
– Management’s plan for debt reduction should also allow for more optimal capital allocation and increased cash returns to shareholders.
Conclusion
Our investment process seeks to identify businesses that, in our opinion, possess a combination of qualities that are both sustainable and difficult to reproduce. While broad macroeconomic factors such as inflation, central bank policies, foreign exchange markets and various other data points are taken into consideration as part of our research, we spend the vast majority of our time analyzing individual companies. Rather than attempting to predict the path of stock prices in the short term, we focus our efforts on understanding businesses over the long term. We believe the long-term benefits of patience and extensive research far outweigh the potential risk of a missed opportunity; seldom are reactionary decisions optimal. While the current market environment seems to be dominated by macro news and geopolitical events, we remain steadfast in our belief that the fundamentals of a company, ultimately, determine its intrinsic worth. As such, we will continue to focus our efforts on studying the unique qualities and characteristics of the companies in which we are invested.
Disclosures
The opinions expressed herein are those of Aristotle Capital Management, LLC (Aristotle Capital) and are subject to change without notice. Past performance is not a guarantee or indicator of future results. This material is not financial advice or an offer to buy or sell any product. You should not assume that any of the securities transactions, sectors or holdings discussed in this report were or will be profitable, or that recommendations Aristotle Capital makes in the future will be profitable or equal the performance of the securities listed in this report. The portfolio characteristics shown relate to the Aristotle International Equity strategy. Not every client’s account will have these characteristics. Aristotle Capital reserves the right to modify its current investment strategies and techniques based on changing market dynamics or client needs. There is no assurance that any securities discussed herein will remain in an account’s portfolio at the time you receive this report or that securities sold have not been repurchased. The securities discussed may not represent an account’s entire portfolio and, in the aggregate, may represent only a small percentage of an account’s portfolio holdings. The performance attribution presented is of a representative account from Aristotle Capital’s International Equity Composite. The representative account is a discretionary client account which was chosen to most closely reflect the investment style of the strategy. The criteria used for representative account selection is based on the account’s period of time under management and its similarity of holdings in relation to the strategy. Recommendations made in the last 12 months are available upon request.
Returns are presented gross and net of investment advisory fees and include the reinvestment of all income. Gross returns will be reduced by fees and other expenses that may be incurred in the management of the account. Net returns are presented net of actual investment advisory fees and after the deduction of all trading expenses.
All investments carry a certain degree of risk, including the possible loss of principal. Investments are also subject to political, market, currency and regulatory risks or economic developments. International investments involve special risks that may in particular cause a loss in principal, including currency fluctuation, lower liquidity, different accounting methods and economic and political systems, and higher transaction costs. These risks typically are greater in emerging markets. Securities of small‐ and medium‐sized companies tend to have a shorter history of operations, be more volatile and less liquid. Value stocks can perform differently from the market as a whole and other types of stocks.
The material is provided for informational and/or educational purposes only and is not intended to be and should not be construed as investment, legal or tax advice and/or a legal opinion. Investors should consult their financial and tax adviser before making investments. The opinions referenced are as of the date of publication, may be modified due to changes in the market or economic conditions, and may not necessarily come to pass. Information and data presented has been developed internally and/or obtained from sources believed to be reliable. Aristotle Capital does not guarantee the accuracy, adequacy or completeness of such information.
Aristotle Capital Management, LLC is an independent registered investment adviser under the Advisers Act of 1940, as amended. Registration does not imply a certain level of skill or training. More information about Aristotle Capital, including our investment strategies, fees and objectives, can be found in our ADV Part 2, which is available upon request.


Composite returns for all periods ended September 30, 2022 are preliminary pending final account reconciliation.
Past performance is not indicative of future results. The information provided should not be considered financial advice or a recommendation to purchase or sell any particular security or product. Performance results for periods greater than one year have been annualized.
Returns are presented gross and net of investment advisory fees and include the reinvestment of all income. Gross returns will be reduced by fees and other expenses that may be incurred in the management of the account. Net returns are presented net of actual investment advisory fees and after the deduction of all trading expenses.
Aristotle Capital Management, LLC is an independent registered investment adviser under the Advisers Act of 1940, as amended. Registration does not imply a certain level of skill or training. More information about Aristotle Capital, including our investment strategies, fees and objectives, can be found in our ADV Part 2, which is available upon request. ACM-2210-44
The MSCI EAFE Index (Europe, Australasia, Far East) is a free float-adjusted market capitalization-weighted index that is designed to measure the equity market performance of developed markets, excluding the United States and Canada. The MSCI EAFE Index consists of the following 21 developed market country indices: Australia, Austria, Belgium, Denmark, Finland, France, Germany, Hong Kong, Ireland, Israel, Italy, Japan, the Netherlands, New Zealand, Norway, Portugal, Singapore, Spain, Sweden, Switzerland and the United Kingdom. The MSCI ACWI captures large and mid-cap representation across 23 developed market countries and 24 emerging markets countries. With approximately 3,000 constituents, the Index covers approximately 85% of the global investable equity opportunity set. The MSCI ACWI Growth Index captures large and mid-cap securities exhibiting overall growth style characteristics across 23 developed markets countries and 24 emerging markets countries. The MSCI ACWI Value Index captures large and mid-cap securities exhibiting overall value style characteristics across 23 developed markets countries and 24 emerging markets countries. The MSCI ACWI ex USA Index captures large and mid-cap representation across 22 of 23 developed markets countries (excluding the United States) and 24 emerging markets countries. With approximately 2,300 constituents, the Index covers approximately 85% of the global equity opportunity set outside the United States. The MSCI Emerging Markets Index is a free float-adjusted market capitalization-weighted index that is designed to measure the equity market performance of emerging markets. The MSCI Emerging Markets Index consists of the following 24 emerging market country indexes: Brazil, Chile, China, Colombia, Czech Republic, Egypt, Greece, Hungary, India, Indonesia, Korea, Kuwait, Malaysia, Mexico, Peru, Philippines, Poland, Qatar, Saudi Arabia, South Africa, Taiwan, Thailand, Turkey and United Arab Emirates. The S&P 500® Index is the Standard & Poor’s Composite Index of 500 stocks and is a widely recognized, unmanaged index of common stock prices. The Brent Crude Oil Index is a major trading classification of sweet light crude oil that serves as a major benchmark price for purchases of oil worldwide. The U.S. Dollar Index (DXY) is a measure of the value of the U.S. dollar relative to the value of a basket of currencies of the majority of the United States’ most significant trading partners. The MSCI Japan Index is designed to measure the performance of the large and mid-cap segments of the Japanese market. With approximately 250 constituents, the Index covers approximately 85% of the free float-adjusted market capitalization in Japan. The Bloomberg Global Aggregate Bond Index is a flagship measure of global investment grade debt from 28 local currency markets. This multi-currency benchmark includes treasury, government-related, corporate and securitized fixed-rate bonds from both developed and emerging markets issuers. The MSCI United Kingdom Index is designed to measure the performance of the large and mid-cap segments of the U.K. market. With nearly 100 constituents, the Index covers approximately 85% of the free float-adjusted market capitalization in the United Kingdom. The MSCI Europe Index captures large and mid-cap representation across 15 developed markets countries in Europe. With approximately 430 constituents, the Index covers approximately 85% of the free float-adjusted market capitalization across the European developed markets equity universe. These indices have been selected as the benchmarks and are used for comparison purposes only. The volatility (beta) of the Composite may be greater or less than the respective benchmarks. It is not possible to invest directly in these indices.
