Commentary
Focus Growth 3Q 2023
Markets Review
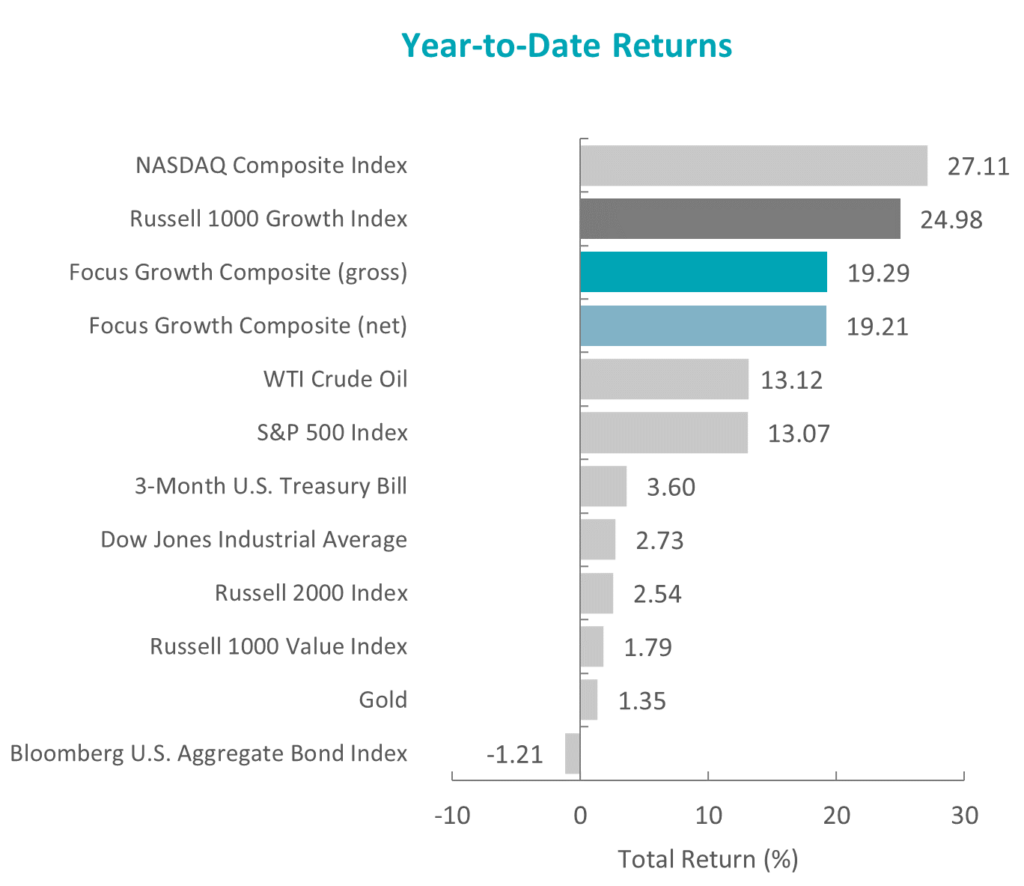
After three consecutive positive quarters, the U.S. equity market pulled back, as the S&P 500 Index declined 3.27% during the quarter. Concurrently, the Bloomberg U.S. Aggregate Bond Index also fell, dropping 3.23% for the quarter. In terms of style, the Russell 1000 Growth Index slightly outperformed its value counterpart by 0.03%.
Sources: CAPS CompositeHubTM, Bloomberg
Past performance is not indicative of future results. Aristotle Atlantic Focus Growth Composite returns are presented gross and net of investment advisory fees and include the reinvestment of all income. Gross returns will be reduced by fees and other expenses that may be incurred in the management of the account. Net returns are presented net of actual investment advisory fees and after the deduction of all trading expenses. Aristotle Atlantic Composite returns are preliminary pending final account reconciliation. Please see important disclosures at the end of this document.
Declines were broad-based, as nine out of the eleven sectors within the Russell 1000 Growth Index finished lower. Utilities, Real Estate and Consumer Staples were the worst-performing sectors. Meanwhile, Energy and Communication Services were the only two sectors in the green, and Health Care declined the least.
Economic growth in the U.S. remained steady, as data released during the quarter showed real GDP increased at an annual rate of 2.1%. The increase was driven by higher levels of consumer and government spending, as well as nonresidential fixed investment. The labor market remained tight during the period, with a 3.8% unemployment rate in August, while average hourly earnings for all employees increased by 4.3% year-over-year.
There was an uptick in inflation reported during the quarter, as annualized CPI increased from 3.0% in June to 3.7% in August. In addition, oil hit its highest level of the year, with both WTI and Brent eclipsing $90 a barrel. Given the concerns about rebounding inflation, 10-year and 30-year Treasury yields spiked to their highest marks since 2007 and 2011, finishing the quarter at 4.59% and 4.73%, respectively. However, the broader trend of disinflation continues, as the 3.7% August CPI figure is still less than half the 8.3% increase the Index experienced the year prior.
After raising its benchmark federal funds rate to a range of 5.25% to 5.50% in July, the Federal Reserve (Fed) held interest rates steady in September, citing a solid pace of expanding economic activity, a slightly softer—yet still strong—labor market and tighter credit conditions. The Fed indicated that it would continue to monitor cumulative monetary policy, the lagged effects of policy decisions, and economic and financial developments when determining the extent of additional rate increases.
On the corporate earnings front, S&P 500 companies reported a 4.1% decline in earnings, the third straight quarter that saw a year-over-year decrease. Despite the drop, fewer companies discussed “recession” and “inflation” during the reporting period. Furthermore, aggregate earnings estimates for the third quarter increased by 0.4% (above the 10-year average of -3.4%), the first increase in nearly two years.
Performance and Attribution Summary
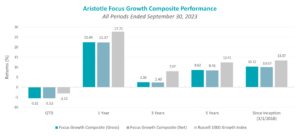
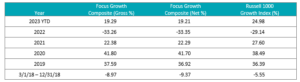
For the third quarter of 2023, Aristotle Atlantic’s Focus Growth Composite posted a total return of -5.51% gross of fees (-5.53% net of fees), underperforming the -3.13% total return of the Russell 1000 Growth Index.
| Performance (%) | 3Q23 | YTD | 1 Year | 3 Years | 5 Years | Since Inception* |
|---|---|---|---|---|---|---|
| Focus Growth Composite (gross) | -5.51 | 19.29 | 22.49 | 2.50 | 8.62 | 10.32 |
| Focus Growth Composite (net) | -5.53 | 19.21 | 22.37 | 2.40 | 8.41 | 10.07 |
| Russell 1000 Growth Index | -3.13 | 24.98 | 27.72 | 7.97 | 12.41 | 13.37 |
Sources: FactSet
Past performance is not indicative of future results. Attribution results are based on sector returns which are gross of investment advisory fees. Attribution is based on performance that is gross of investment advisory fees and includes the reinvestment of income. Please see important disclosures at the end of this document.
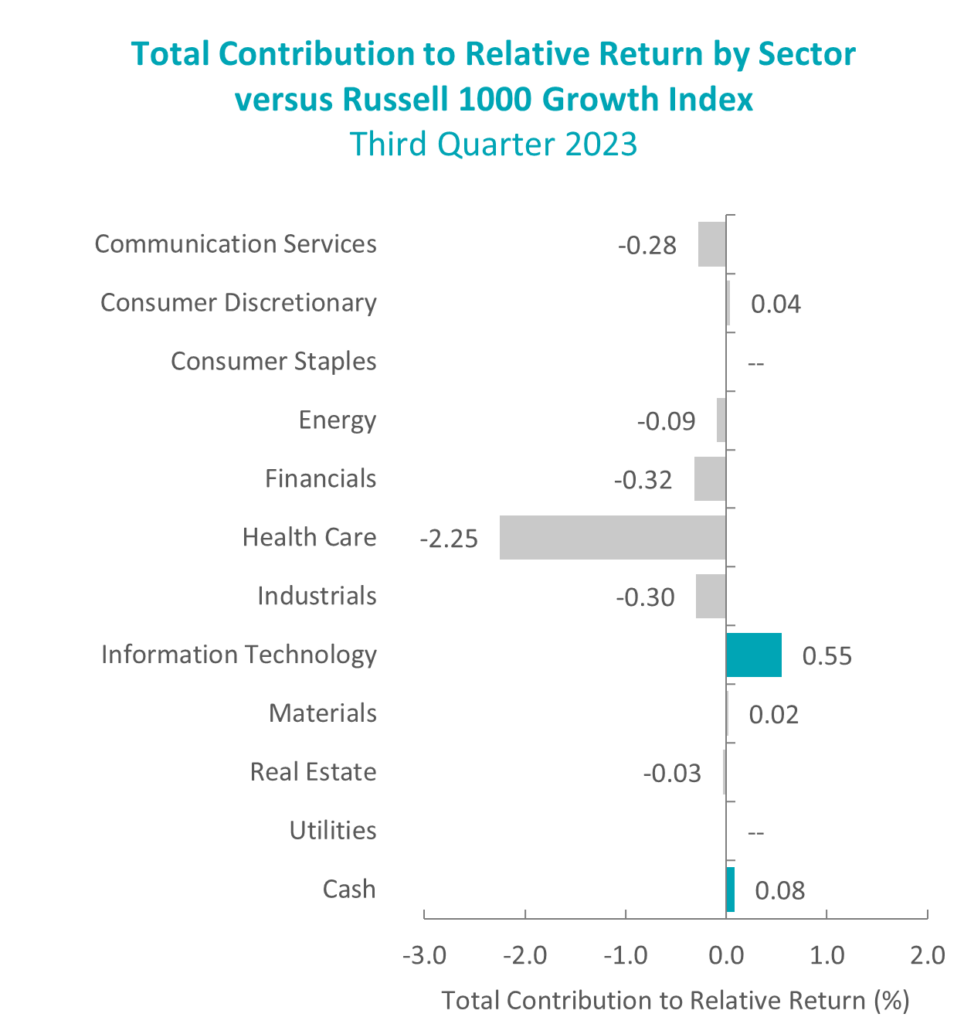
During the third quarter, the portfolio’s underperformance relative to the Russell 1000 Growth Index was due to both allocation effects and security selection. Security selection in Health Care, Financials and Industrials detracted the most from performance. Conversely, security selection in Information Technology and Real Estate, as well as an overweight in Financials, contributed to relative results.
Contributors and Detractors for 3Q 2023
| Relative Contributors | Relative Detractors |
|---|---|
| Apple | DexCom |
| Synopsys | Sage Therapeutics |
| Costco Wholesale | Darling Ingredients |
| Nvidia | Iovance Biotherapeutics |
| ServiceNow | Bio-Techne |
Contributors
Apple
Apple contributed to outperformance in the third quarter, as a result of the underweight position relative to the benchmark. Following a very strong first-half performance, the stock saw a pullback ahead of the iPhone 15 launch, as investors weigh the potential growth from the new phone in the face of macroeconomic headwinds and slowing consumer spend.
Synopsys
Synopsys contributed to performance in the quarter as the company reported third quarter revenues that were above consensus, additionally the company raised fiscal year guidance for 2023. Synopsys continues to be a key beneficiary from the demand for semiconductors throughout the entire economy, as well as the increasing complexity of semiconductor design, particularly for silicon used in the artificial intelligence (AI) technology stack. The company is also leveraging AI for its design tools which can drive increased usage and improve margins for the company’s tools.
Detractors
DexCom
DexCom shares were weaker in the third quarter following Novo Nordisk’s announcement of topline data from the SELECT trial on cardiovascular outcomes on patients using their weight loss drug Wegovy on August 8th. The trial showed a 20% reduction in major adverse cardiovascular events in patients using the drug. This led to broad-based pressure on companies in the diabetes space, as well as those exposed to other weight-related maladies. The weakness came despite DexCom reporting 26% organic growth and raising full-year guidance in late July. We continue to see continuous glucose monitoring devices playing an important role in driving better health outcomes for diabetes patients and believe that given the low penetration rates, DexCom can continue to grow.
Darling Ingredients
Darling Ingredients shares were weak in the third quarter after the company reported an inline quarter and reaffirmed guidance for the fourth quarter. Diamond Green Diesel had a planned downtime in July when an unexpected fire resulted in 10 days of no production in Norco Los Angeles later in the quarter. Higher interest rates this month pressured companies with outsized leverage, such as Darling Ingredients, and they are working on deleveraging following several acquisitions last year.
Recent Portfolio Activity
The table below shows all buys and sells completed during the quarter, followed by a brief rationale.
| Buys | Sells |
|---|---|
| Adobe | Crowdstrike Holdings |
| Meta Platforms | NXP Semiconductors |
| Sage Therapeutics | |
| Iovance Biotechnologies |
Buys
Adobe
Adobe is one of the largest and most diversified software companies in the world. It has been known for brands such as Acrobat, Photoshop and Adobe Document Cloud. Adobe’s business is organized into three reportable segments: Digital Media, Digital Experience, and Publishing and Advertising. The Company’s products allow users to express and use information across all print and electronic media.
We see Adobe as a key enabler of digital transformation initiatives through the Digital Media and Digital Experience business segments. Adobe continues to innovate and integrate new capabilities across all its product suites. We see several products per customer continuing to increase, as Adobe users continue to use more products. We see this as a competitive advantage.
Meta Platforms
Meta Platforms, formerly known as Facebook, is a global technology company specializing in social networking and the development of augmented and virtual reality technologies. Founded in 2004 and headquartered in Menlo Park, CA, the company has expanded its reach to nearly three billion monthly active users worldwide.
We see Meta as well-positioned to capture a significant share of the rapidly growing digital advertising market and has created an interconnected ecosystem of apps that drives higher user engagements. While leveraging AI and machine learning technology, Meta should see an acceleration in the development of targeted digital advertising capabilities and enhance the user experience across its platform. We see near-term catalysts in Rising Reels and Messenger revenue monetization and an expected robust 2024 political and Olympic advertising. Year-to-date, investors have been optimistic about the company’s pivot away from a focus on metaverse investments to an emphasis on profitability and growth in what the company calls its “Year of Efficiency.”
Sells
CrowdStrike Holdings
We sold CrowdStrike Holdings and believe that recent channel checks and commentary from competitors and software companies indicate increasing headwinds across multiple industry verticals. We also believe that macroeconomic conditions and high interest rates are resulting in shorter contract cycles which also represent headwinds to Free Cash Flow growth. While the company continues to be an industry leader in endpoint detection, we view a potential slowdown.
NXP Semiconductors
We sold NXP Semiconductors to reduce our exposure to the automotive sector in semiconductors following the strong returns over the past 3 years. We are seeing early data of slowing global auto sales due to macroeconomic conditions and higher interest rates. While we think this may be a shorter-term slowdown, the risk is increasing of elevated inventory levels and pricing headwinds.
Sage Therapeutics
We sold Sage Therapeutics following results of the company’s new drug application for Zuranalone that was approved in Post Partem Depression (PPD), but not major depressive disorder (MDD). The complete response letter (CRL) on MDD stated that the company would need to complete additional trials to prove the efficacy and durability in MDD, so they are evaluating next steps along with Biogen. Sage was unable to say how committed they or Biogen would be to funding additional studies at this point. Given the uncertainty surrounding the company, we decided to exit the position.
Iovance Biotherapeutics
We sold Iovance Biotherapeutics, following uncertainty which arose from the company canceling out of two investor events. Iovance is in the late stages of FDA review on their lead candidate Lifileucel in advanced melanoma. These cancellations could stem from issues with site inspections which tend to take place later in the review cycle. The company has not commented on why it canceled these investor events, and we do not think this bodes well for the prospects of a straightforward approval with a clean, positive label for the company.
Outlook
The equity markets in the third quarter were negatively impacted by a steep rise in interest rates. The move in interest rates reflects the outlook that the Fed will have to keep rates higher for longer to get inflation under control. Rising oil prices did not help the inflation outlook but did result in pushing the Energy sector into positive territory and making the sector the best performer for the period. The consumer is now facing higher gasoline prices at the pump, and those with student loans are now faced with renewed interest payments due to the failed attempt to forgive student debt. This has resulted in an increased probability of slower economic growth due to these challenges. The one bright spot continues to be the strong backlog of orders in the industrial segment of the economy. We have yet to see a material benefit from the recently passed legislative packages that could extend and add to these backlogs. We are now entering a period where the economy should show signs of slowing given the duration and severity of rate hikes on the part of the Fed. The equity markets may very well welcome bad economic news as a sign that the rate cycle is finally coming to an end. Our focus will continue to be at the company level, with an emphasis on seeking to invest in companies with secular tailwinds or strong product-driven cycles.
The opinions expressed herein are those of Aristotle Atlantic Partners, LLC (Aristotle Atlantic) and are subject to change without notice. Past performance is not a guarantee or indicator of future results. This material is not financial advice or an offer to purchase or sell any product. You should not assume that any of the securities transactions, sectors or holdings discussed in this report were or will be profitable, or that recommendations Aristotle Atlantic makes in the future will be profitable or equal the performance of the listed in this report. The portfolio characteristics shown relate to the Aristotle Atlantic Focus Growth strategy. Not every client’s account will have these characteristics. Aristotle Atlantic reserves the right to modify its current investment strategies and techniques based on changing market dynamics or client needs. There is no assurance that any securities discussed herein will remain in an account’s portfolio at the time you receive this report or that securities sold have not been repurchased. The securities discussed may not represent an account’s entire portfolio and, in the aggregate, may represent only a small percentage of an account’s portfolio holdings. The performance attribution presented is of a representative account from Aristotle Atlantic’s Focus Growth Composite. The representative account is a discretionary client account which was chosen to most closely reflect the investment style of the strategy. The criteria used for representative account selection is based on the account’s period of time under management and its similarity of holdings in relation to the strategy. Recommendations made in the last 12 months are available upon request. Returns are presented gross and net of investment advisory fees and include the reinvestment of all income. Gross returns will be reduced by fees and other expenses that may be incurred in the management of the account. Net returns are presented net of actual investment advisory fees and after the deduction of all trading expenses.
All investments carry a certain degree of risk, including the possible loss of principal. Investments are also subject to political, market, currency and regulatory risks or economic developments. International investments involve special risks that may in particular cause a loss in principal, including currency fluctuation, lower liquidity, different accounting methods and economic and political systems, and higher transaction costs. These risks typically are greater in emerging markets. Securities of small‐ and medium‐sized companies tend to have a shorter history of operations, be more volatile and less liquid. Value stocks can perform differently from the market as a whole and other types of stocks.
The material is provided for informational and/or educational purposes only and is not intended to be and should not be construed as investment, legal or tax advice and/or a legal opinion. Investors should consult their financial and tax adviser before making investments. The opinions referenced are as of the date of publication, may be modified due to changes in the market or economic conditions, and may not necessarily come to pass. Information and data presented has been developed internally and/or obtained from sources believed to be reliable. Aristotle Atlantic does not guarantee the accuracy, adequacy or completeness of such information.
Aristotle Atlantic Partners, LLC is an independent registered investment adviser under the Advisers Act of 1940, as amended. Registration does not imply a certain level of skill or training. More information about Aristotle Atlantic, including our investment strategies, fees and objectives, can be found in our Form ADV Part 2, which is available upon request. AAP-2310-34
Sources: CAPS Composite Hub, Russell Investments
Composite returns for all periods ended September 30, 2023 are preliminary pending final account reconciliation.
Past performance is not indicative of future results. Performance results for periods greater than one year have been annualized. Returns are presented gross and net of investment advisory fees and include the reinvestment of all income. Gross returns will be reduced by fees and other expenses that may be incurred in the management of the account. Net returns are presented net of actual investment advisory fees and after the deduction of all trading expenses.
The Russell 1000® Growth Index measures the performance of the large cap growth segment of the U.S. equity universe. It includes those Russell 1000 companies with higher price-to-book ratios and higher forecasted growth values. This index has been selected as the benchmark and is used for comparison purposes only. The Russell 1000® Value Index measures the performance of the large cap value segment of the U.S. equity universe. It includes those Russell 1000 companies with lower price-to-book ratios and lower expected growth values. The S&P 500® Index is the Standard & Poor’s Composite Index of 500 stocks and is a widely recognized, unmanaged index of common stock prices. The Russell 2000® Index measures the performance of the small cap segment of the U.S. equity universe. The Russell 2000 Index is a subset of the Russell 3000® Index representing approximately 10% of the total market capitalization of that index. It includes approximately 2,000 of the smallest securities based on a combination of their market cap and current index membership. The Dow Jones Industrial Average® is a price-weighted measure of 30 U.S. blue-chip companies. The Index covers all industries except transportation and utilities. The NASDAQ Composite Index measures all NASDAQ domestic and international based common type stocks listed on The NASDAQ Stock Market. The NASDAQ Composite includes over 3,000 companies, more than most other stock market indices. The Bloomberg U.S. Aggregate Bond Index is an unmanaged index of domestic investment grade bonds, including corporate, government and mortgage-backed securities. The WTI Crude Oil Index is a major trading classification of sweet light crude oil that serves as a major benchmark price for oil consumed in the United States. The 3-Month U.S. Treasury Bill is a short-term debt obligation backed by the U.S. Treasury Department with a maturity of three months. The Consumer Price Index (CPI) is a measure of the average change over time in the prices paid by urban consumers for a market basket of consumer goods and services. While stock selection is not governed by quantitative rules, a stock typically is added only if the company has an excellent reputation, demonstrates sustained growth and is of interest to a large number of investors. The volatility (beta) of the Composite may be greater or less than its respective benchmarks. It is not possible to invest directly in these indices.