Commentary
Corporate Credit 1Q 2023
Summary
U.S. corporate credit markets ended the quarter broadly higher, as U.S. yields declined while credit spreads were mixed. High yield bonds outperformed by a small margin, as the Bloomberg U.S. Corporate High Yield Bond Index returned 3.57%. Investment grade corporate bonds and bank loans also finished higher, with the Bloomberg U.S. Corporate Bond Index rising 3.50% and the Credit Suisse Leveraged Loan Index gaining 3.11%. Lower yields supported fixed income more broadly, as the Bloomberg U.S. Aggregate Bond Index rose 2.96% in the first quarter.
The U.S. equity market also rallied, as the S&P 500 Index gained 7.50% during the quarter. Despite a round trip in rate hike expectations, concerns around persistent inflation, underwhelming earnings and a banking crisis in March, risk assets ended the quarter on a strong note. Concerning the U.S. economic data, inflation showed signs of easing slightly in February, with the annual inflation rate slowing to 6.0%, the lowest since September 2021, and in line with market forecasts. The U.S. labor market continued to hold in strong with better-than-expected non-farm payrolls prints in January and February, while the unemployment rate edged up slightly from a 50-year low to 3.6% in February. While the events in the banking sector in March included the second-largest bank failure by assets in U.S. history, the Federal Deposit Insurance Corporation’s (FDIC) swift response combined with the Federal Reserve’s (Fed) announcement of a new emergency liquidity facility helped quell short-term fears of contagion. Nonetheless, worries about tighter credit conditions, deposit flight and exposure to other areas of concern, including commercial real estate, weighed on the sector through the end of the quarter.
The Fed continued to gradually increase interest rates in the first quarter, hiking by 25 basis points at its February and March meetings and bringing its benchmark rate to a range of 4.75% to 5.00%, the highest level since 2007. While the market was concerned about financial stability risks ahead of the March meeting, the Fed acknowledged inflation remains elevated and stated further rate hikes may be necessary. Nonetheless, Chairman Powell also recognized the series of rate hikes over the past year are still making their way through the economy and, while not the Fed’s base case, he opened the door to the possibility of rate cuts later this year should inflation fall faster than expected.
Market Environment
U.S. Treasury yields, particularly in the short end, experienced significant volatility in the first quarter, as the market digested changing expectations around the path of the Fed’s monetary policy. The yield on the U.S. 2-year note jumped more than 100 basis points from early February to early March, only to fall nearly 150 basis points in mid-March and end the quarter roughly 36 basis points lower. To put this in perspective, following the collapse of Silicon Valley Bank (SVB) in mid-March, the 3-day slide in yield on the 2-year note was the largest since 1987. The yield on the U.S. 10-year note fell roughly 39 basis points during the quarter, while the yield spread between the 2-year and 10-year notes briefly fell below 100 basis points in March, the most inverted since 1981, before rebounding into the end of the quarter.
While U.S. corporate credit spreads ended the quarter near where they were at the end of last year, credit spreads also experienced significant volatility. High yield bond spreads tightened below 400 basis points in early February, widened to above 500 basis points in late March and ended the quarter roughly 14 basis points tighter, as measured by the Bloomberg U.S. Corporate High Yield Bond Index. Investment grade corporate bond spreads widened modestly, ending the first quarter roughly 8 basis points wider, largely driven by wider spreads in banking.
Issuance in the high yield bond and leveraged loan markets dropped off sharply at the end of the first quarter. After a pickup in the primary market in January, high yield bond issuance slowed significantly in March, with year-to-date issuance totaling just over $40 billion, a 13% decline compared to the same period a year earlier. Leveraged loan issuance experienced an even sharper decline, with issuance totaling roughly $70 billion, a 42% decline compared to the prior year. Despite the slowest March in a decade for investment grade corporate bond issuance, total issuance topped $390 billion in the first quarter, which falls in the middle of the historical range over the last ten years.
Retail flows exhibited a flight to safety during the first quarter, as high yield bond and leveraged loan funds continued to experience outflows, and investment grade corporate bond funds saw inflows. After outflows topped $48 billion in 2022, a record annual outflow, high yield bond funds experienced further outflows of roughly $16 billion during the first quarter. Outflows from leveraged loan funds accelerated in March, totaling just over $9 billion for the quarter compared to nearly $13 billion of outflows in 2022. Investment grade corporate bond funds experienced a reversal from 2022, as year-to-date inflows topped $21 billion. Despite persistent outflows, negative net issuance and a supply/demand imbalance have helped support the overall high yield bond and bank loan markets over the past several months.
Within the high yield bond universe, lower-quality bonds had the strongest returns during the quarter, as ‘CCC’s (+4.96%) outperformed ‘B’s (+3.47%) and ‘BB’s (+3.44%). From an industry perspective, Lodging & Leisure (+8.49%) outperformed, while Banking (-0.41%) underperformed. Defaults and distressed exchanges picked up in the first quarter, with the year-to-date total already amounting to 43% of 2022’s total. The 12-month trailing, par-weighted U.S. high yield default rate, including distressed exchanges, rose roughly 30 basis points to 1.91% (1.27%, excluding distressed exchanges), below the long-term historical average of 3.20% (2.90%, excluding distressed exchanges). Meanwhile, the loan par-weighted default rate, including distressed exchanges, ended March at 2.22% (1.72%, excluding distressed exchanges), below the long-term historical average of 3.10% (3.00%, excluding distressed exchanges).
Performance and Attribution Summary
High Yield Bond
The Aristotle High Yield Bond Composite returned 2.82% gross of fees (2.76% net of fees) in the first quarter, underperforming the 3.55% return of the ICE BofA BB-B U.S. Cash Pay High Yield Constrained Index. Security selection was the primary detractor from relative performance, while industry allocation contributed to relative performance.
Security selection detracted from relative performance led by holdings in Telecommunications and Lodging & Leisure. This was partially offset by selection in Media & Entertainment and Real Estate Investment Trusts (REITs) & Real Estate-Related. Sector rotation also detracted from relative performance led by the allocation to cash. The allocations to investment grade corporate bonds and bank loans also detracted from relative performance. Industry allocation contributed to relative performance led by overweights in Lodging & Leisure and Transportation. This was partially offset by overweights in Media & Entertainment and Gaming.
| Top Five Contributors | Top Five Detractors |
|---|---|
| QVC | Level 3 Financing |
| AMC Networks | Carnival |
| American Airlines | iHeartMedia |
| DISH Network | Titan International |
| Lions Gate Capital | Gray Television |
Investment Grade Corporate
The Aristotle Investment Grade Corporate Bond Composite returned 3.66% gross of fees (3.60% net of fees) in the first quarter, outperforming the 3.50% return of the Bloomberg U.S. Corporate Bond Index. Security selection was the primary contributor to relative performance, while industry allocation detracted from relative performance.
Security selection contributed to relative performance led by holdings in Transportation and Brokerage. This was partially offset by selection in Banking and REITs & Real Estate-Related. Industry allocation detracted from relative performance led by overweights in Insurance and REITs & Real Estate-related. This was partially offset by an overweight in Pipelines & Distributors and an underweight in Healthcare. Sector rotation also detracted from relative performance, led by the allocation to cash. There were no offsetting contributors. Additionally, short duration positioning and yield curve positioning marginally detracted from relative performance.
| Top Five Contributors | Top Five Detractors |
|---|---|
| Warner Bros Discovery | MetLife |
| United Airlines | Alexandria Real Estate |
| Brookfield Finance | Wells Fargo |
| Brown & Brown | Fifth Third Bank |
| JetBlue | Bank of America |
Strategic Credit
The Aristotle Strategic Credit Composite returned 2.61% gross of fees (2.49% net of fees1) in the first quarter, underperforming the 3.03% return of the blended benchmark of one-third Bloomberg U.S. High Yield Ba/B 2% Issuer Capped Bond Index, one-third Bloomberg U.S. Intermediate Corporate Bond Index and one-third Credit Suisse Leveraged Loan Index. Security selection was the primary detractor from relative performance. Industry allocation and sector rotation also detracted from relative performance.
Security selection detracted from relative performance led by holdings in Lodging & Leisure and Telecommunications. This was partially offset by selection in Banking and Transportation. Industry allocation also detracted from relative performance led by overweights in Telecommunications and Pipelines & Distributors. This was partially offset by overweights in Lodging & Leisure and Media & Entertainment. Additionally, sector rotation detracted marginally from relative performance led by an underweight in bank loans and the allocation to cash. This was mostly offset by an underweight in investment grade corporate bonds and an overweight in high yield bonds.
1As of March 31, 2023, 31% of the Composite consisted of a non-fee-paying account.
| Top Five Contributors | Top Five Detractors |
|---|---|
| MGM Resorts | Lumen Technologies |
| Service Properties Trust | QVC |
| R.R. Donnelley & Sons | Titan International |
| Tri Pointe Homes | Energy Transfer |
| United Airlines | DISH |
Outlook
While uncertainty has increased since the end of 2022, we believe U.S. corporate credit remains healthy given strong corporate balance sheets and reasonable levels of leverage. While the U.S. economy is showing signs of slowing and the recent shock to the banking system is likely to lead to tighter financial conditions, we believe U.S. corporate credit markets are in better shape than they have been ahead of other slowdowns. In our opinion, more caution is warranted, but we continue to see the opportunity for positive total returns in U.S. corporate credit given higher levels of carry and strong fundamentals.
The Fed’s focus over the past year has been on persistent, elevated inflation, but following recent turmoil in the banking sector, we believe they will now also be keeping a close eye on overall market stability. We believe the knock-on effects of the Fed’s hiking cycle, which began just over one year ago, are still making their way through the U.S. economy. We see the current issues with regional banks as a byproduct of the delayed impact of monetary policy, following years of easy monetary policy. While goods and commodity inflation has shown some signs of abating, services inflation remains elevated, and in our opinion, the Fed may respond with another hike or two in the coming months. As a result, we believe rates have some room to climb modestly over the next quarter.
We believe the overall U.S. economy has shown signs of resilience, as supply chains ease, the labor market remains tight and consumer spending holds up. We also recognize tighter financial conditions will, more than likely, weaken the economy. Despite recent signs of the labor market softening in certain areas (e.g., technology), we hold the view that the overall job market remains historically tight and should be relatively resilient in the event of a mild downturn. Consumer spending showed signs of slowing in the first quarter, with consumers beginning to feel the impact of higher rates. In our view, consumer spending and the labor market will continue to be critical areas to watch, as the effects of restrictive monetary policy work their way through the U.S. economy, increasing the potential for a recession this year.
Technical factors remain supportive of U.S. corporate credit markets, with net issuance and supply/demand dynamics offsetting outflows, particularly in the high yield bond and bank loan markets. This has been supportive of credit spreads, which were largely lower in the first quarter, excluding wider spreads for Financials. Additionally, as the Fed nears the end of its hiking cycle, we believe the U.S. Treasury market should be relatively well supported. Nonetheless, the effects of quantitative tightening (QT) have not yet fully impacted markets, as the Fed’s balance sheet tightening has been offset by increased liquidity from global central banks, including the Bank of Japan and the People’s Bank of China. In our opinion, as QT continues, it will likely lead to lower liquidity and more uncertainty, which can ultimately lead to higher real rates. However, in our view, corporate credit markets should be able to weather such conditions.
In our opinion, U.S. companies are in overall better shape than they have been in the past when entering a period of economic softness. We believe most corporate balance sheets are strong, debt levels are reasonable and near-term maturities have been managed well. Furthermore, we think companies learned many lessons after 2008/09 and have done a better job managing leverage and liquidity in recent years. While risk-free rates can rise and credit spreads can widen from here, in our opinion, the U.S. corporate credit market can absorb some economic weakness. We believe many companies are in a better place than they were heading into prior downturns. Overall, we remain cautiously optimistic and expect modestly positive total returns, as U.S. corporate credit markets should be able to withstand a mild downturn.
High Yield Bond Positioning
In our high yield portfolios, we remain underweight duration relative to the benchmark and continue to focus on credit risk in the front end of the curve. While we are still cautious on most cyclical sectors, especially goods-related cyclicals, we remain positive on experience-related cyclicals.
While the yield curve remains inverted, we continue to see more opportunities to add credit risk on the front end of the curve. Given high yield credit spreads have tightened since the end of 2022, we continue to avoid going much further down in quality. Considering we believe the economy may be headed for a slowdown, we will focus on discipline in credit selection as we evaluate opportunities ahead.
We still see an opportunity in credits that should benefit from a rebound in consumer spending on experiences this year, such as Transportation and Travel & Leisure. We also favor commodity-related sectors. For example, we believe U.S. oil producers will be more disciplined in this cycle, as they more carefully moderate supply growth. At the end of the quarter, we held overweights in Transportation, Media & Entertainment and Energy alongside underweights in Technology, Telecommunications and Cable & Satellite.
Investment Grade Corporate Positioning
In our investment grade corporate bond portfolios, we modestly increased duration and are looking for opportunities further out the curve. Similar to our high yield bond portfolios, we remain cautious on most cyclical sectors while focusing on experience-related cyclicals and commodity-related credits.
After being underweight duration for much of the past year, we are moving to a more neutral stance. We continue to look for yield in junior subordinated bank securities. However, our banking exposure is concentrated on the largest money center banks, which we view as relatively well-positioned despite lingering risks to regional banks.
From an industry perspective, the largest overweights and underweights in the portfolio were unchanged compared to the prior quarter. At the end of the quarter, we held overweights in REITs & Real Estate-Related, Insurance and Finance Companies alongside underweights in Banking, Retailers & Restaurants and Pharmaceuticals.
Strategic Credit Positioning
In our strategic credit portfolios, overall asset allocation was largely unchanged, and we kept duration positioning largely in line with the blended benchmark. At the industry level, adjustments to the general risk profile were similar to those made in our high yield bond portfolios.
During the quarter, we did not make any tactical changes to the portfolio related to sector rotation. High yield bonds remain the largest allocation in the portfolio. On the margin, we slightly reduced an overweight in high yield bonds, while slightly decreasing an underweight in investment grade corporate bonds. Bank loan exposure remains unchanged as the largest underweight position.
As of March 31, the strategy was composed of 67.1% high yield bonds, 26.3% investment grade corporate bonds and 4.1% bank loans. Roughly 2.5% was held in cash. We held overweights in Energy, Lodging & Leisure and Pipelines & Distributors alongside underweights in Technology, Industrials and Healthcare.
All investments carry a certain degree of risk, including the possible loss of principal. Investments are also subject to political, market, currency and regulatory risks or economic developments. There are risks specifically associated with fixed income investments such as interest rate risk and credit risk. Bond values fluctuate in price in response to market conditions. Typically, when interest rates rise, there is a corresponding decline in bond values. This risk may be more pronounced for bonds with longer-term maturities. Credit risk refers to the possibility that the bond issuer will not be able to make principal and interest payments. High yield securities are generally rated lower than investment grade securities and may be subject to greater market fluctuations, increased price volatility, risk of issuer default, less liquidity, or loss of income and principal compared to investment grade securities.
The material is provided for informational and/or educational purposes only and is not intended to be and should not be construed as investment, legal or tax advice and/or a legal opinion. Investors should consult their financial and tax adviser before making investments.
The opinions referenced are as of the date of publication, may be modified due to changes in the market or economic conditions, and may not necessarily come to pass.
Information and data presented has been developed internally and/or obtained from sources believed to be reliable. Aristotle Credit does not guarantee the accuracy, adequacy or completeness of such information.
The opinions expressed herein are those of Aristotle Credit Partners, LLC (Aristotle Credit) and are subject to change without notice. Past performance is not a guarantee or indicator of future results. This material is not financial advice or an offer to buy or sell any product. You should not assume that any of the securities transactions, sectors or holdings discussed in this report are or will be profitable, or that recommendations Aristotle Credit makes in the future will be profitable or equal the performance of the securities listed in this report. The portfolio characteristics shown relate to the Aristotle Credit High Yield Bond strategy, the Aristotle Credit Investment Grade Corporate Bond strategy and the Aristotle Credit Strategic Credit strategy. Not every client’s account will have these characteristics. Aristotle Credit reserves the right to modify its current investment strategies and techniques based on changing market dynamics or client needs. There is no assurance that any securities discussed herein will remain in an account’s portfolio at the time you receive this report or that securities sold have not been repurchased. The securities discussed may not represent an account’s entire portfolio and, in the aggregate, may represent only a small percentage of an account’s portfolio holdings. For a full list of all recommendations made by Aristotle Credit during the last 12 months, please contact us at (949) 681-2100. This is not a recommendation to buy or sell a particular security.
Past performance is not indicative of future results. Performance results for periods greater than one year have been annualized. Composite returns are preliminary pending final account reconciliation. Composite and benchmark returns reflect the reinvestment of income.
Composite returns are presented gross and net of investment advisory fees and include the reinvestment of all income. Gross returns will be reduced by fees and other expenses that may be incurred in the management of the account. Net returns are presented net of actual investment advisory fees and after the deduction of all trading expenses.
Strategic Credit Returns – Composite and benchmark returns reflect the reinvestment of income. Gross returns will be reduced by fees and other expenses that may be incurred in the management of the account. Model Net Performance: Composite returns are presented net of the highest fee charged.
Aristotle Credit Partners, LLC is an independent registered investment adviser under the Advisers Act of 1940, as amended. Registration does not imply a certain level of skill or training. More information about Aristotle Credit, including our investment strategies, fees and objectives, can be found in our Form ADV Part 2, which is available upon request. ACP-2304-17
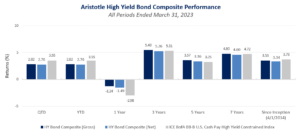
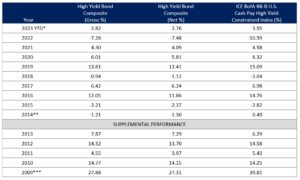
Sources: SS&C Advent; FTSE
*Composite returns are preliminary pending final account reconciliation.
**2014 is a partial-year period of nine months, representing data from April 1, 2014 to December 31, 2014.
***2009 is a partial-year period of ten months, representing data from March 1, 2009 to December 31, 2009.
Past performance is not indicative of future results. Composite returns are presented gross and net of investment advisory fees and include the reinvestment of all income. Gross returns will be reduced by fees and other expenses that may be incurred in the management of the account. Net returns are presented net of actual investment advisory fees and after the deduction of all trading expenses. The Aristotle High Yield Bond strategy has an inception date of April 1, 2014; however, the strategy initially began at Douglas Lopez’s predecessor firm. A supplemental performance track record from March 1, 2009 to December 31, 2013 (Mr. Lopez’s departure from the firm) is provided. The returns are based on a separate account from the strategy while it was being managed at Doug Lopez’s predecessor firm and performance results are based on custodian data. During this time, Mr. Lopez had primary responsibility for managing the account. Please refer to disclosures at the end of this document.
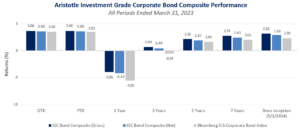
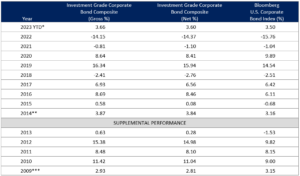
Sources: SS&C Advent, Bloomberg
*Composite returns are preliminary pending final account reconciliation.
**2014 is a partial-year period of eight months, representing data from May 1, 2014 to December 31, 2014.
***2009 is a partial-year period of four months, representing data from September 1, 2009 to December 31, 2009.
Past performance is not indicative of future results. Composite returns are presented gross and net of investment advisory fees and include the reinvestment of all income. Gross returns will be reduced by fees and other expenses that may be incurred in the management of the account. Net returns are presented net of actual investment advisory fees and after the deduction of all trading expenses. The primary benchmark was retroactively changed from Bloomberg U.S. Credit Bond Index to Bloomberg U.S. Corporate Bond Index effective March 31, 2017. The Aristotle Investment Grade Corporate Bond strategy has an inception date of May 1, 2014; however, the strategy initially began at Terence Reidt’s predecessor firm. A supplemental performance track record from September 1, 2009 to December 31, 2013 (Mr. Reidt’s departure from the firm) is provided. The returns are based on a separate account from the strategy while it was being managed at Terence Reidt’s predecessor firm and performance results are based on custodian data. During this time, Mr. Reidt had primary responsibility for managing the account. Please refer to disclosures at the end of this document.
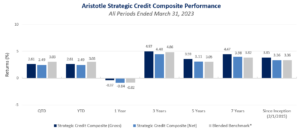
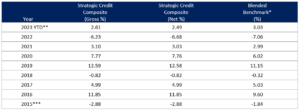
Sources: SS&C Advent, Bloomberg, Credit Suisse
*Blended benchmark represents a blend of blend of 1/3 Bloomberg U.S. High Yield Ba/B 2% Issuer Capped Bond Index, 1/3 Bloomberg U.S. Intermediate Corporate Bond Index and 1/3 Credit Suisse Leveraged Loan Index. The Bloomberg U.S. High Yield Loans Index was retired on September 30, 2016 and was replaced with the Credit Suisse Leveraged Loan Index effective October 1, 2016.
**Composite returns are preliminary pending final account reconciliation.
***2015 is a partial-year period of eleven months, representing data from February 1, 2015 to December 31, 2015.
Past performance is not indicative of future results. Composite and benchmark returns reflect the reinvestment of income. Gross returns will be reduced by fees and other expenses that may be incurred in the management of the account. Model Net Performance: Composite returns are presented net of the highest fee charged. Please refer to disclosures at the end of this document.
The Bloomberg U.S. Aggregate Bond Index is a broad base, market capitalization-weighted bond market index representing intermediate term investment grade bonds traded in the United States. The Index is frequently used as a stand-in for measuring the performance of the U.S. bond market. In addition to investment grade corporate debt, the Index tracks government debt, mortgage-backed securities (MBS) and asset-backed securities (ABS) to simulate the universe of investable bonds that meet certain criteria. In order to be included in the Index, bonds must be of investment grade or higher, have an outstanding par value of at least $100 million and have at least one year until maturity. The Bloomberg U.S. Corporate Bond Index measures the investment grade, fixed-rate, taxable corporate bond market. It includes securities publicly issued by U.S. and non-U.S. industrial, utility and financial issuers that are all U.S. dollar denominated. The Bloomberg U.S. Corporate Bond Index is a component of the Bloomberg U.S. Credit Bond Index. The Bloomberg U.S. Corporate High Yield Bond Index measures the U.S. dollar-denominated, high yield, fixed-rate corporate bond market. Securities are classified as high yield if the middle rating of Moody’s, Fitch and S&P is Ba1/BB+/BB+ or below. Bonds from issuers with an emerging markets country of risk, based on Bloomberg EM country definition, are excluded. The S&P 500 Index is the Standard & Poor’s Composite Index and is a widely recognized, unmanaged index of common stock prices. It is market cap weighted and includes 500 leading companies, capturing approximately 80% coverage of available market capitalization. The ICE Bank of America (ICE BofA) BB-B U.S. Cash Pay High Yield Constrained Index measures the performance of the U.S. dollar-denominated BB-rated and B-rated corporate debt issued in the U.S. domestic market, a fixed coupon schedule and a minimum amount outstanding of $100 million, issued publicly. Allocations to an individual issuer in the Index will not exceed 2%. The Credit Suisse Leveraged Loan Index is a market-weighted index designed to track the performance of the investable universe of the U.S. dollar-denominated leveraged loan market. The Bloomberg U.S. High Yield Ba/B 2% Issuer Capped Bond Index is an issuer-constrained version of the U.S. Corporate High Yield Index that measures the market of U.S. dollar-denominated, non-investment grade, fixed-rate, taxable corporate bonds rated Ba/B. The Index limits the maximum exposure to any one issuer to 2%. The Bloomberg U.S. Intermediate Corporate Bond Index is designed to measure the performance of U.S. corporate bonds that have a maturity of greater than or equal to one year and less than 10 years. The Index includes investment grade, fixed-rate, taxable, U.S. dollar-denominated debt with $250 million or more par amount outstanding, issued by U.S. and non-U.S. industrial, utility and financial institutions. Yield to worst (YTW) is a measure of the lowest possible yield that can be received on a bond that fully operates within the terms of its contract without defaulting. The volatility (beta) of the Composites may be greater or less than the indices. It is not possible to invest directly in these indices. Composite and index returns reflect the reinvestment of income.

